Instrumentation for Light Aircraft
Market:
Builders of Experimental Aircraft
Competencies:
Analog Circuit Design
Digital Circuit Design
Embedded Controller Hardware Design
Embedded Controller Firmware Design
CAN Protocol Communications Design
PCB Layout
Basic Physics
Design of Instrumentation for Light Aircraft
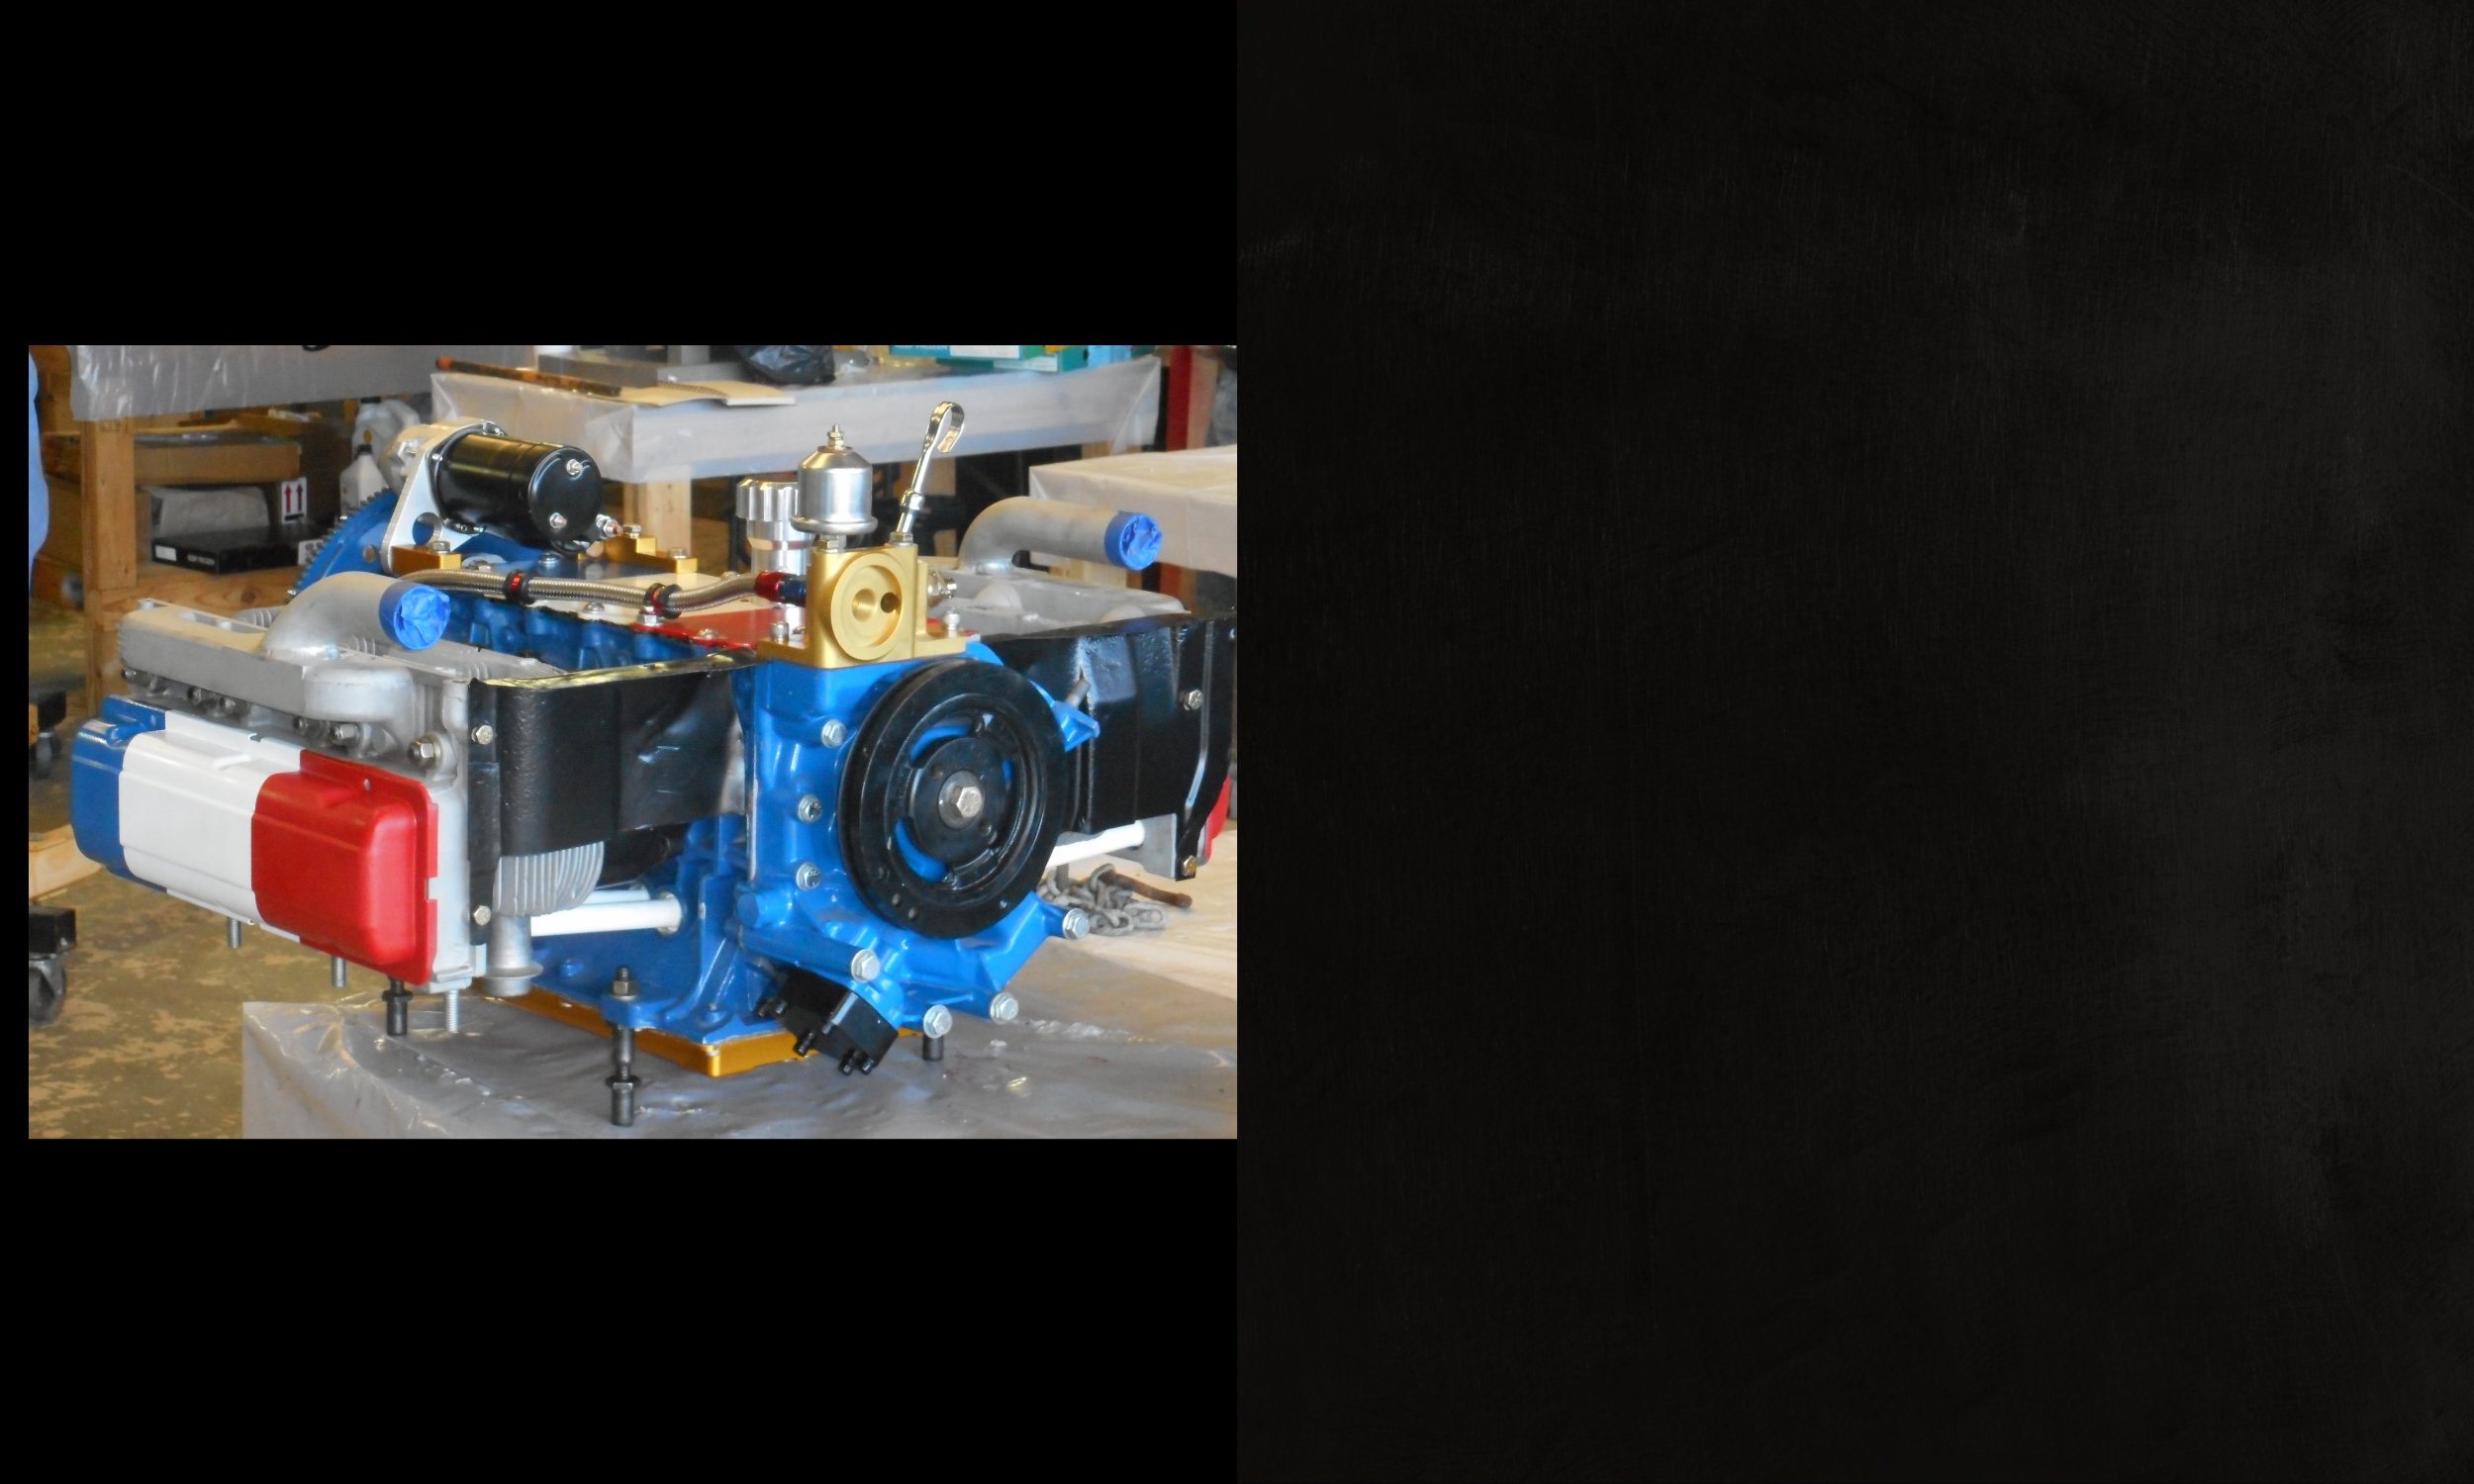
For some time, the cockpit instruments of light aircraft have been getting increasingly sophisticated, even as the actual sender units have not — particularly where “firewall forward” engine monitoring equipment has been concerned. A big part of the reason for this is that glass panels for light aircraft are usually single-board computers running embedded Linux and have things such as GPS and “flight aware” software built into them. Where these computers come up short is in their ability to connect to other sending units in the airplane.
Of late, a standard has emerged (“CAN Aerospace”) based on the popular CAN protocol now used ubiquitously in the auto industry. And an engine monitoring device that can aggregate all of the analog signals from things like oil pressure senders or temperature monitors into a CAN Aerospace bitstream can vastly improve the connectivity to a glass cockpit as well as reduce the number (and weight) of wires required to get the signals around the inside of the airframe.
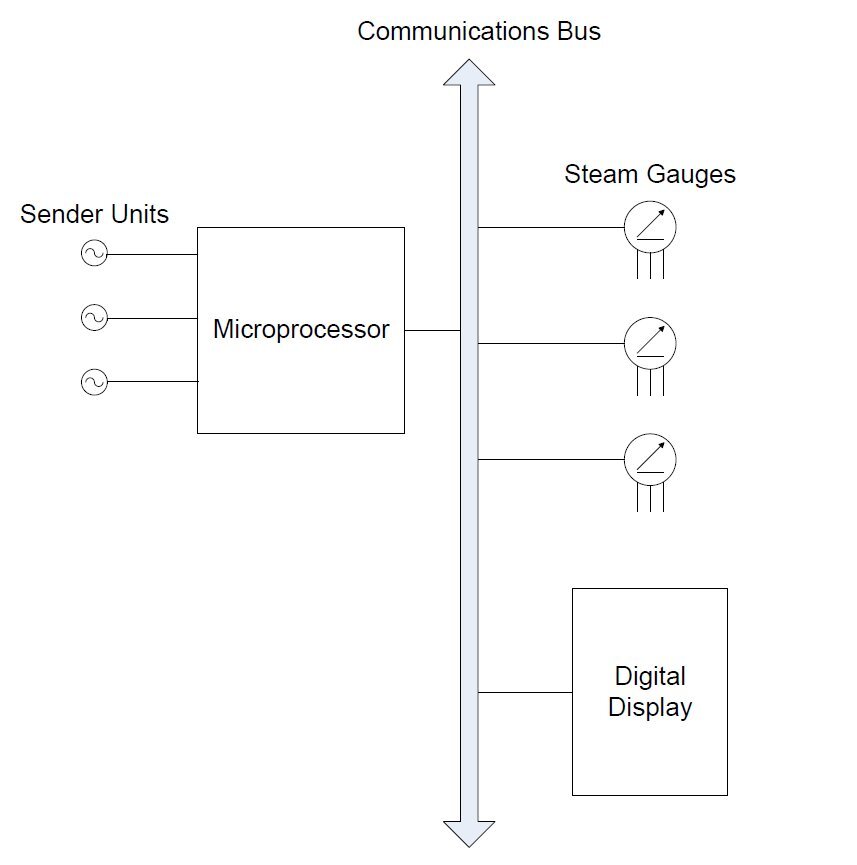
What We’re Doing Now: The Overall Architecture
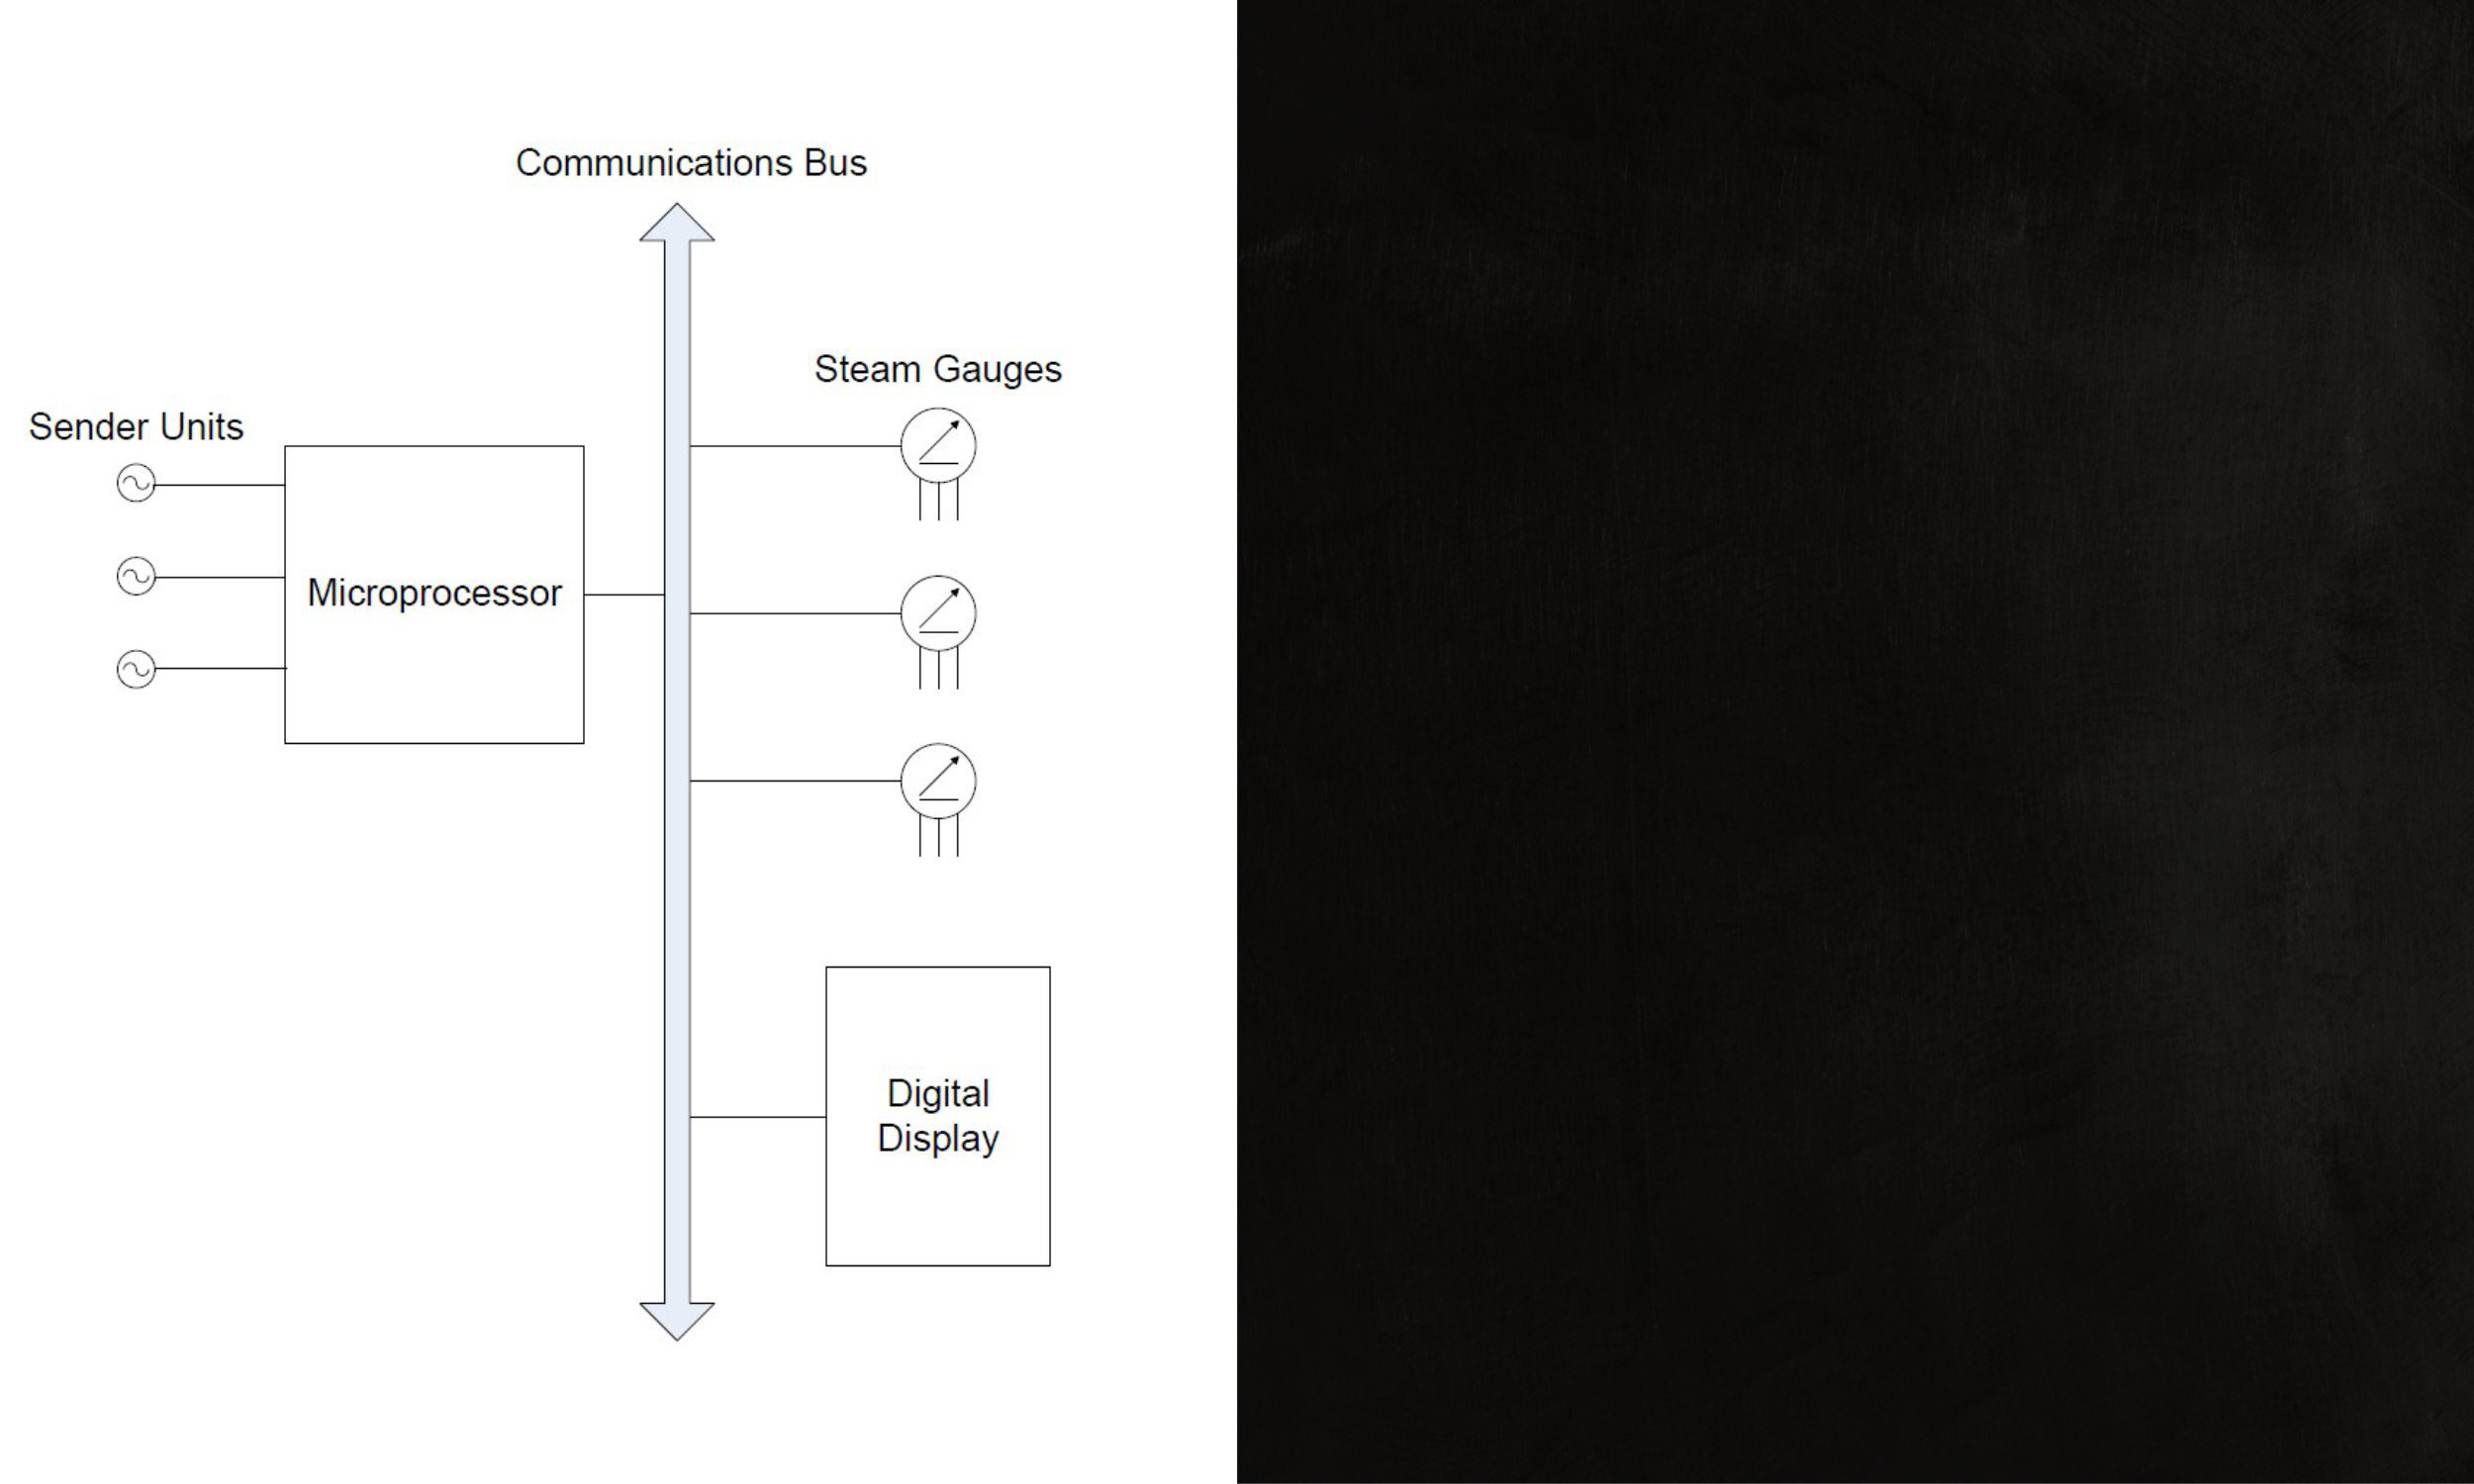
It’s our goal to develop a system that can digitize data from multiple sender units and relay those data in digital format over a single connection to a CAN Aerospace bus. We have designed the system such that each sender occupies a “mailbox” as defined by the standardizations of CAN Aerospace. A glass panel could therefore use standard CAN Aerospace addressing to retrieve sender data. Or old-school “steam gauges” (where a single gauge with a needle that moves around a dial) could do the same with just a little bit of CAN intelligence built into them.
There would also be nothing preventing other senders not associated with the engine (such as those for airspeed, altitude, etc.) from sharing this CAN bus, since all data rates would be reasonably low (reducing the odds of congestion on the bus) and each device would have its own mailbox.
What We Did: A First Mockup of a Device to Measure Oil Pressure, Engine RPM, Oil Temperature, and Cylinder Head Temperature.
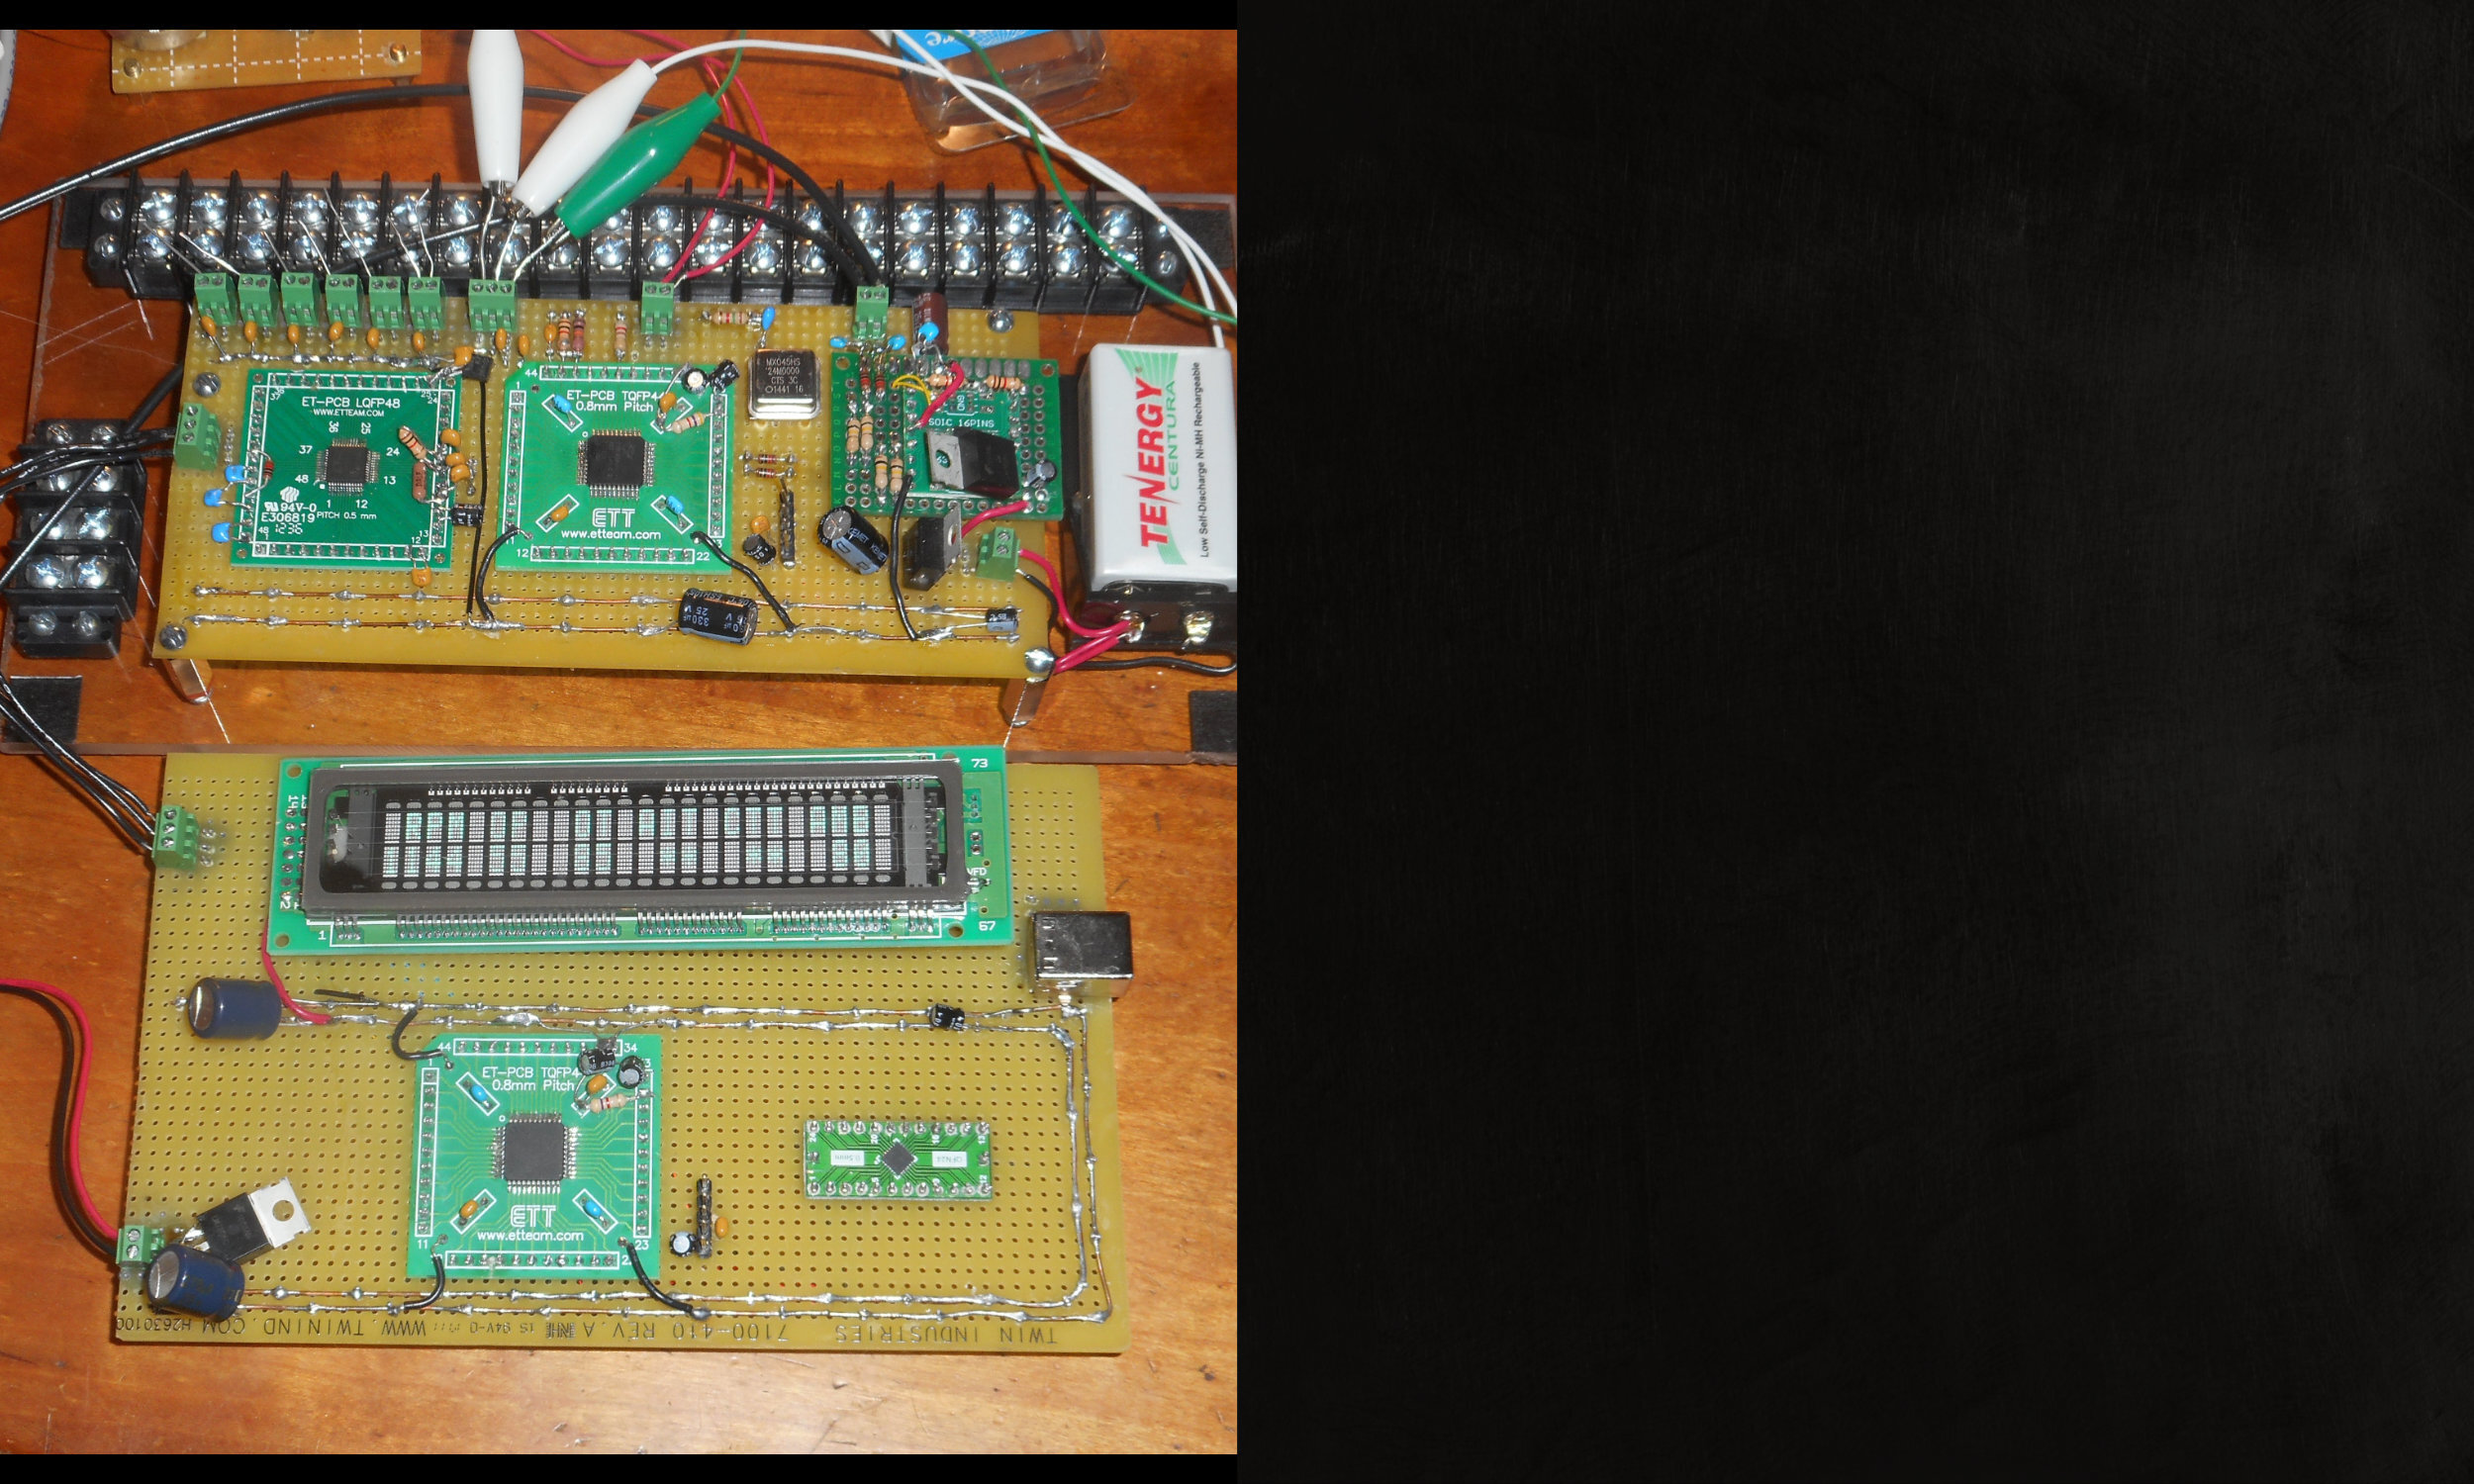
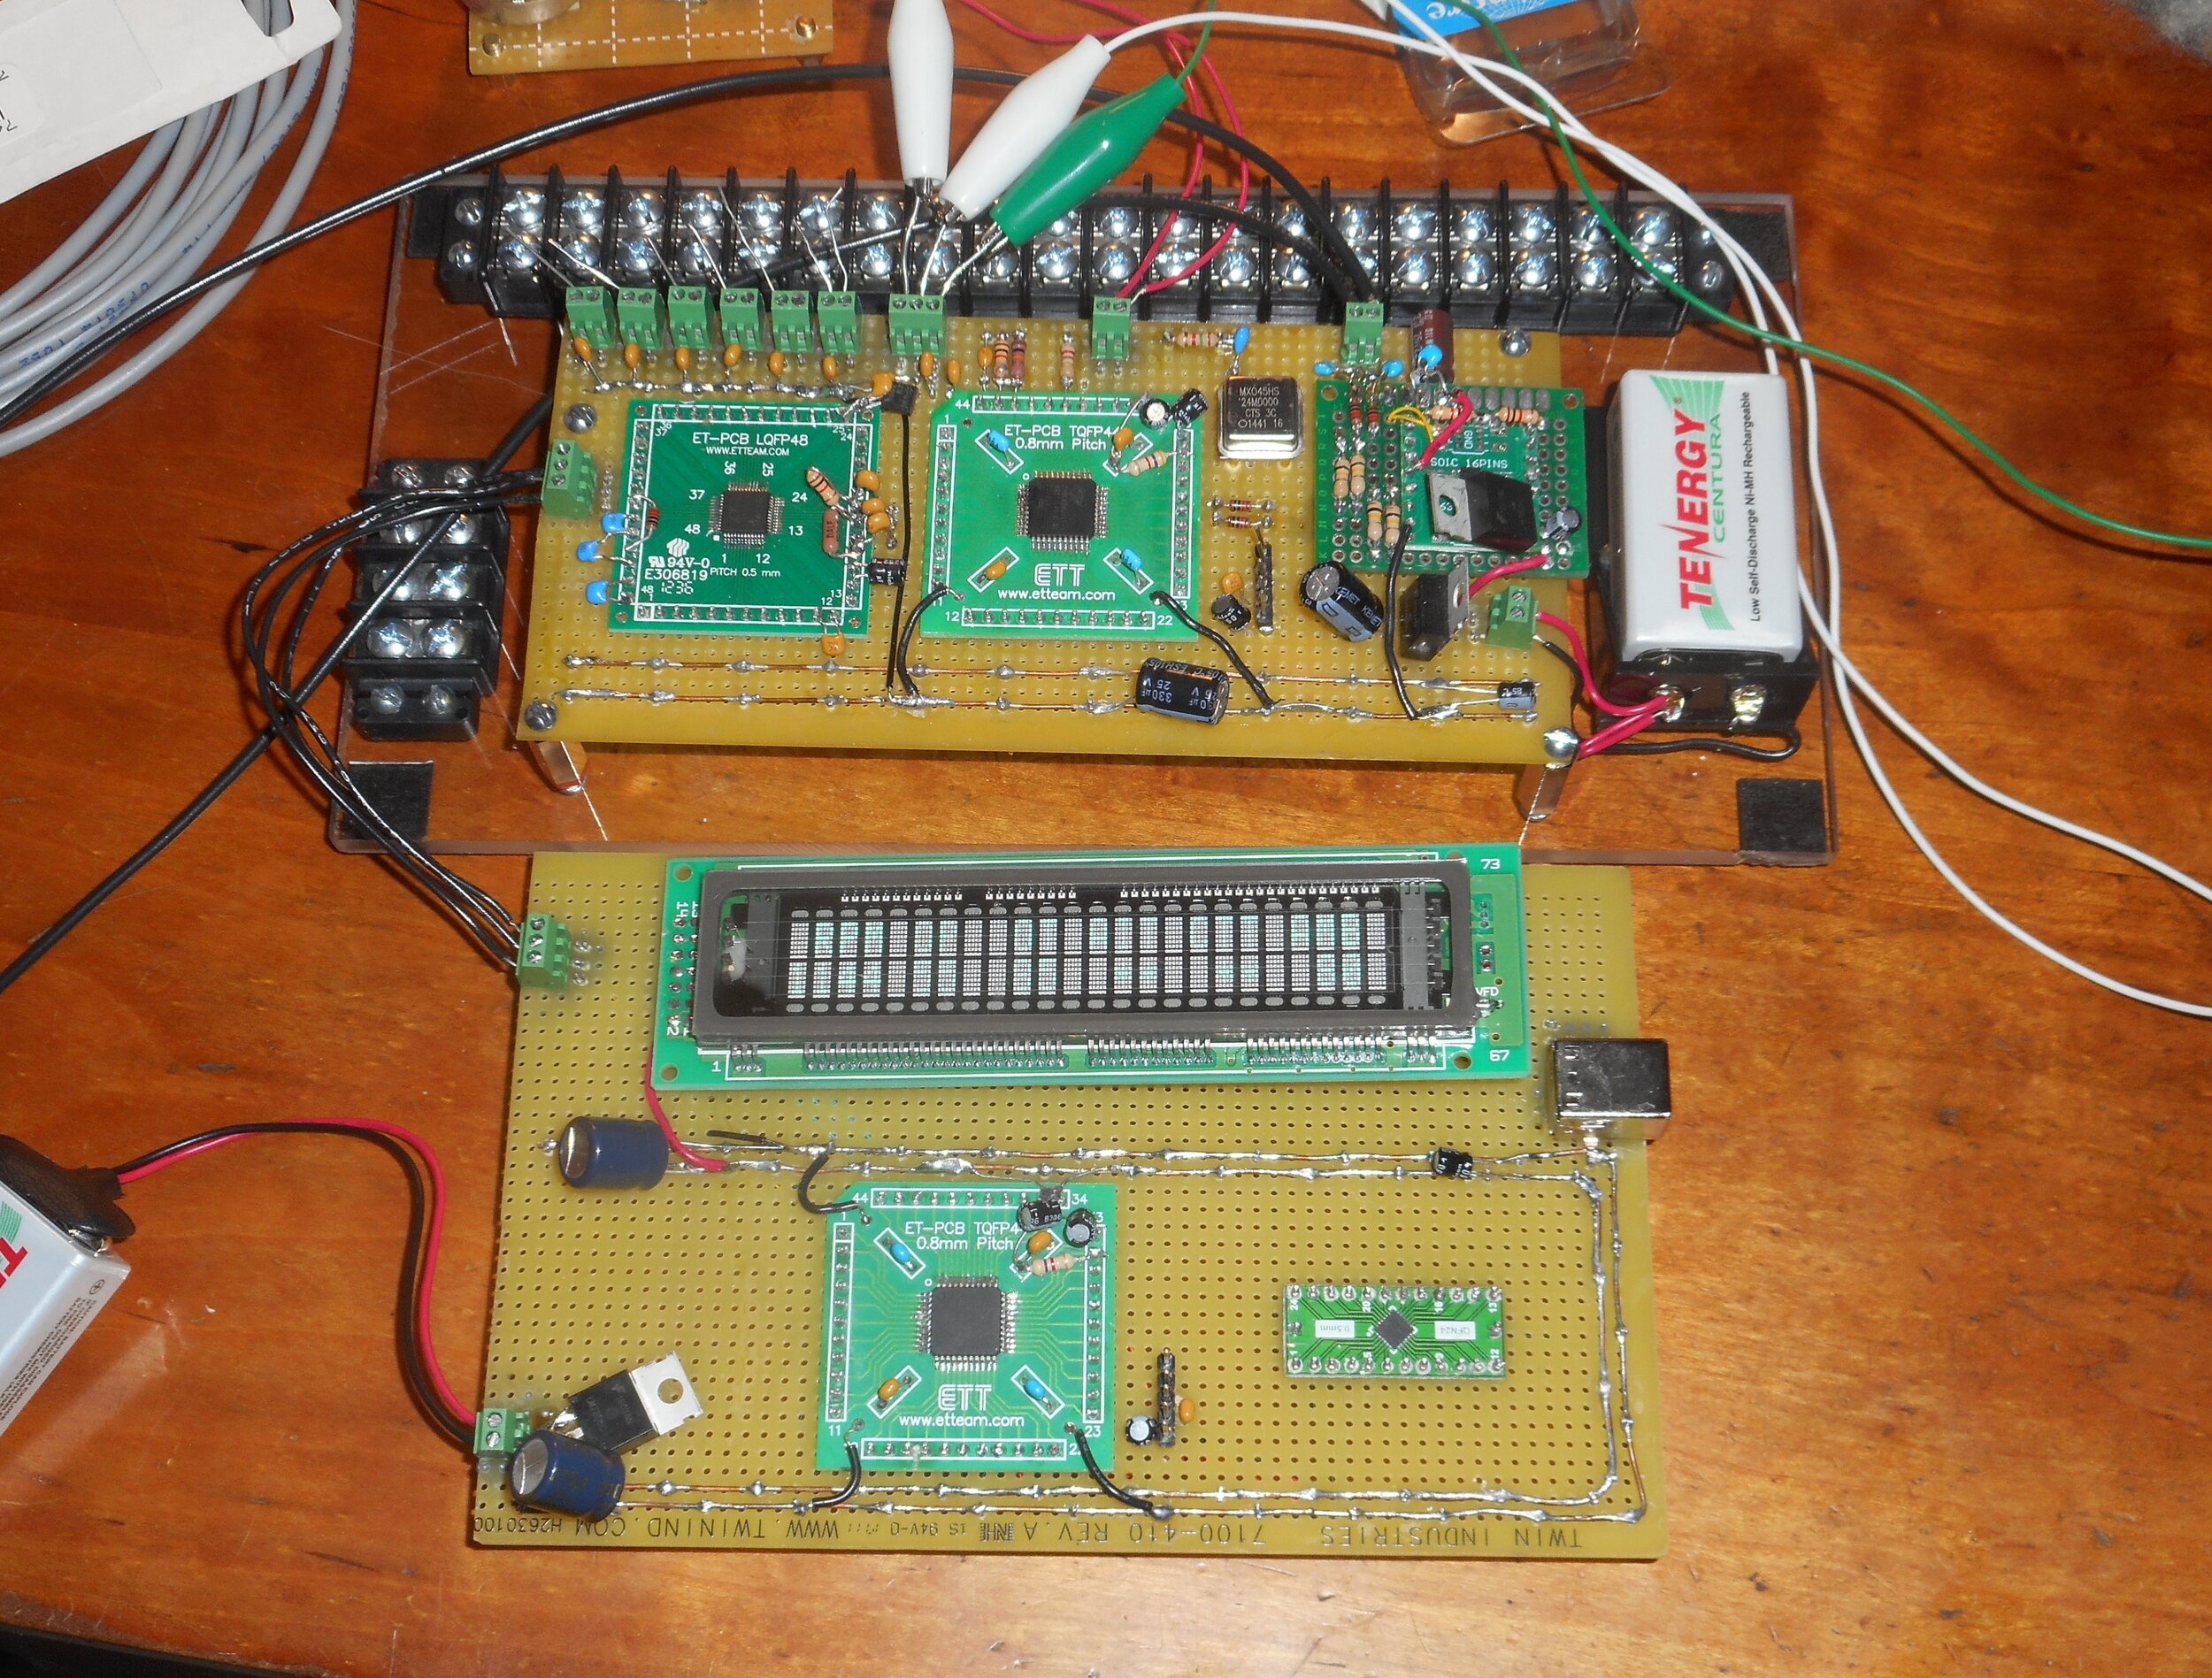
At top in this photo, you can see a breadboarded circuit capable of measuring Oil Pressure (by digitizing an analog signal with an A-to-D converter), Engine RPM (using the counter-timers in an onboard microcontroller), Oil Temperature, and Cylinder Head Temperature (both accomplished with a specialized chip to read chromel-alumel thermocouples and output SPI data to the host controller.
The board below takes the aggregated data from the first board and puts it out on a vacuum flourescent display where we can read them. Data are sent over an I2C bus in this initial mockup, done before we got all of our CAN drivers running.
What We Did: Reluctance Transducer Analog Front End Measurement
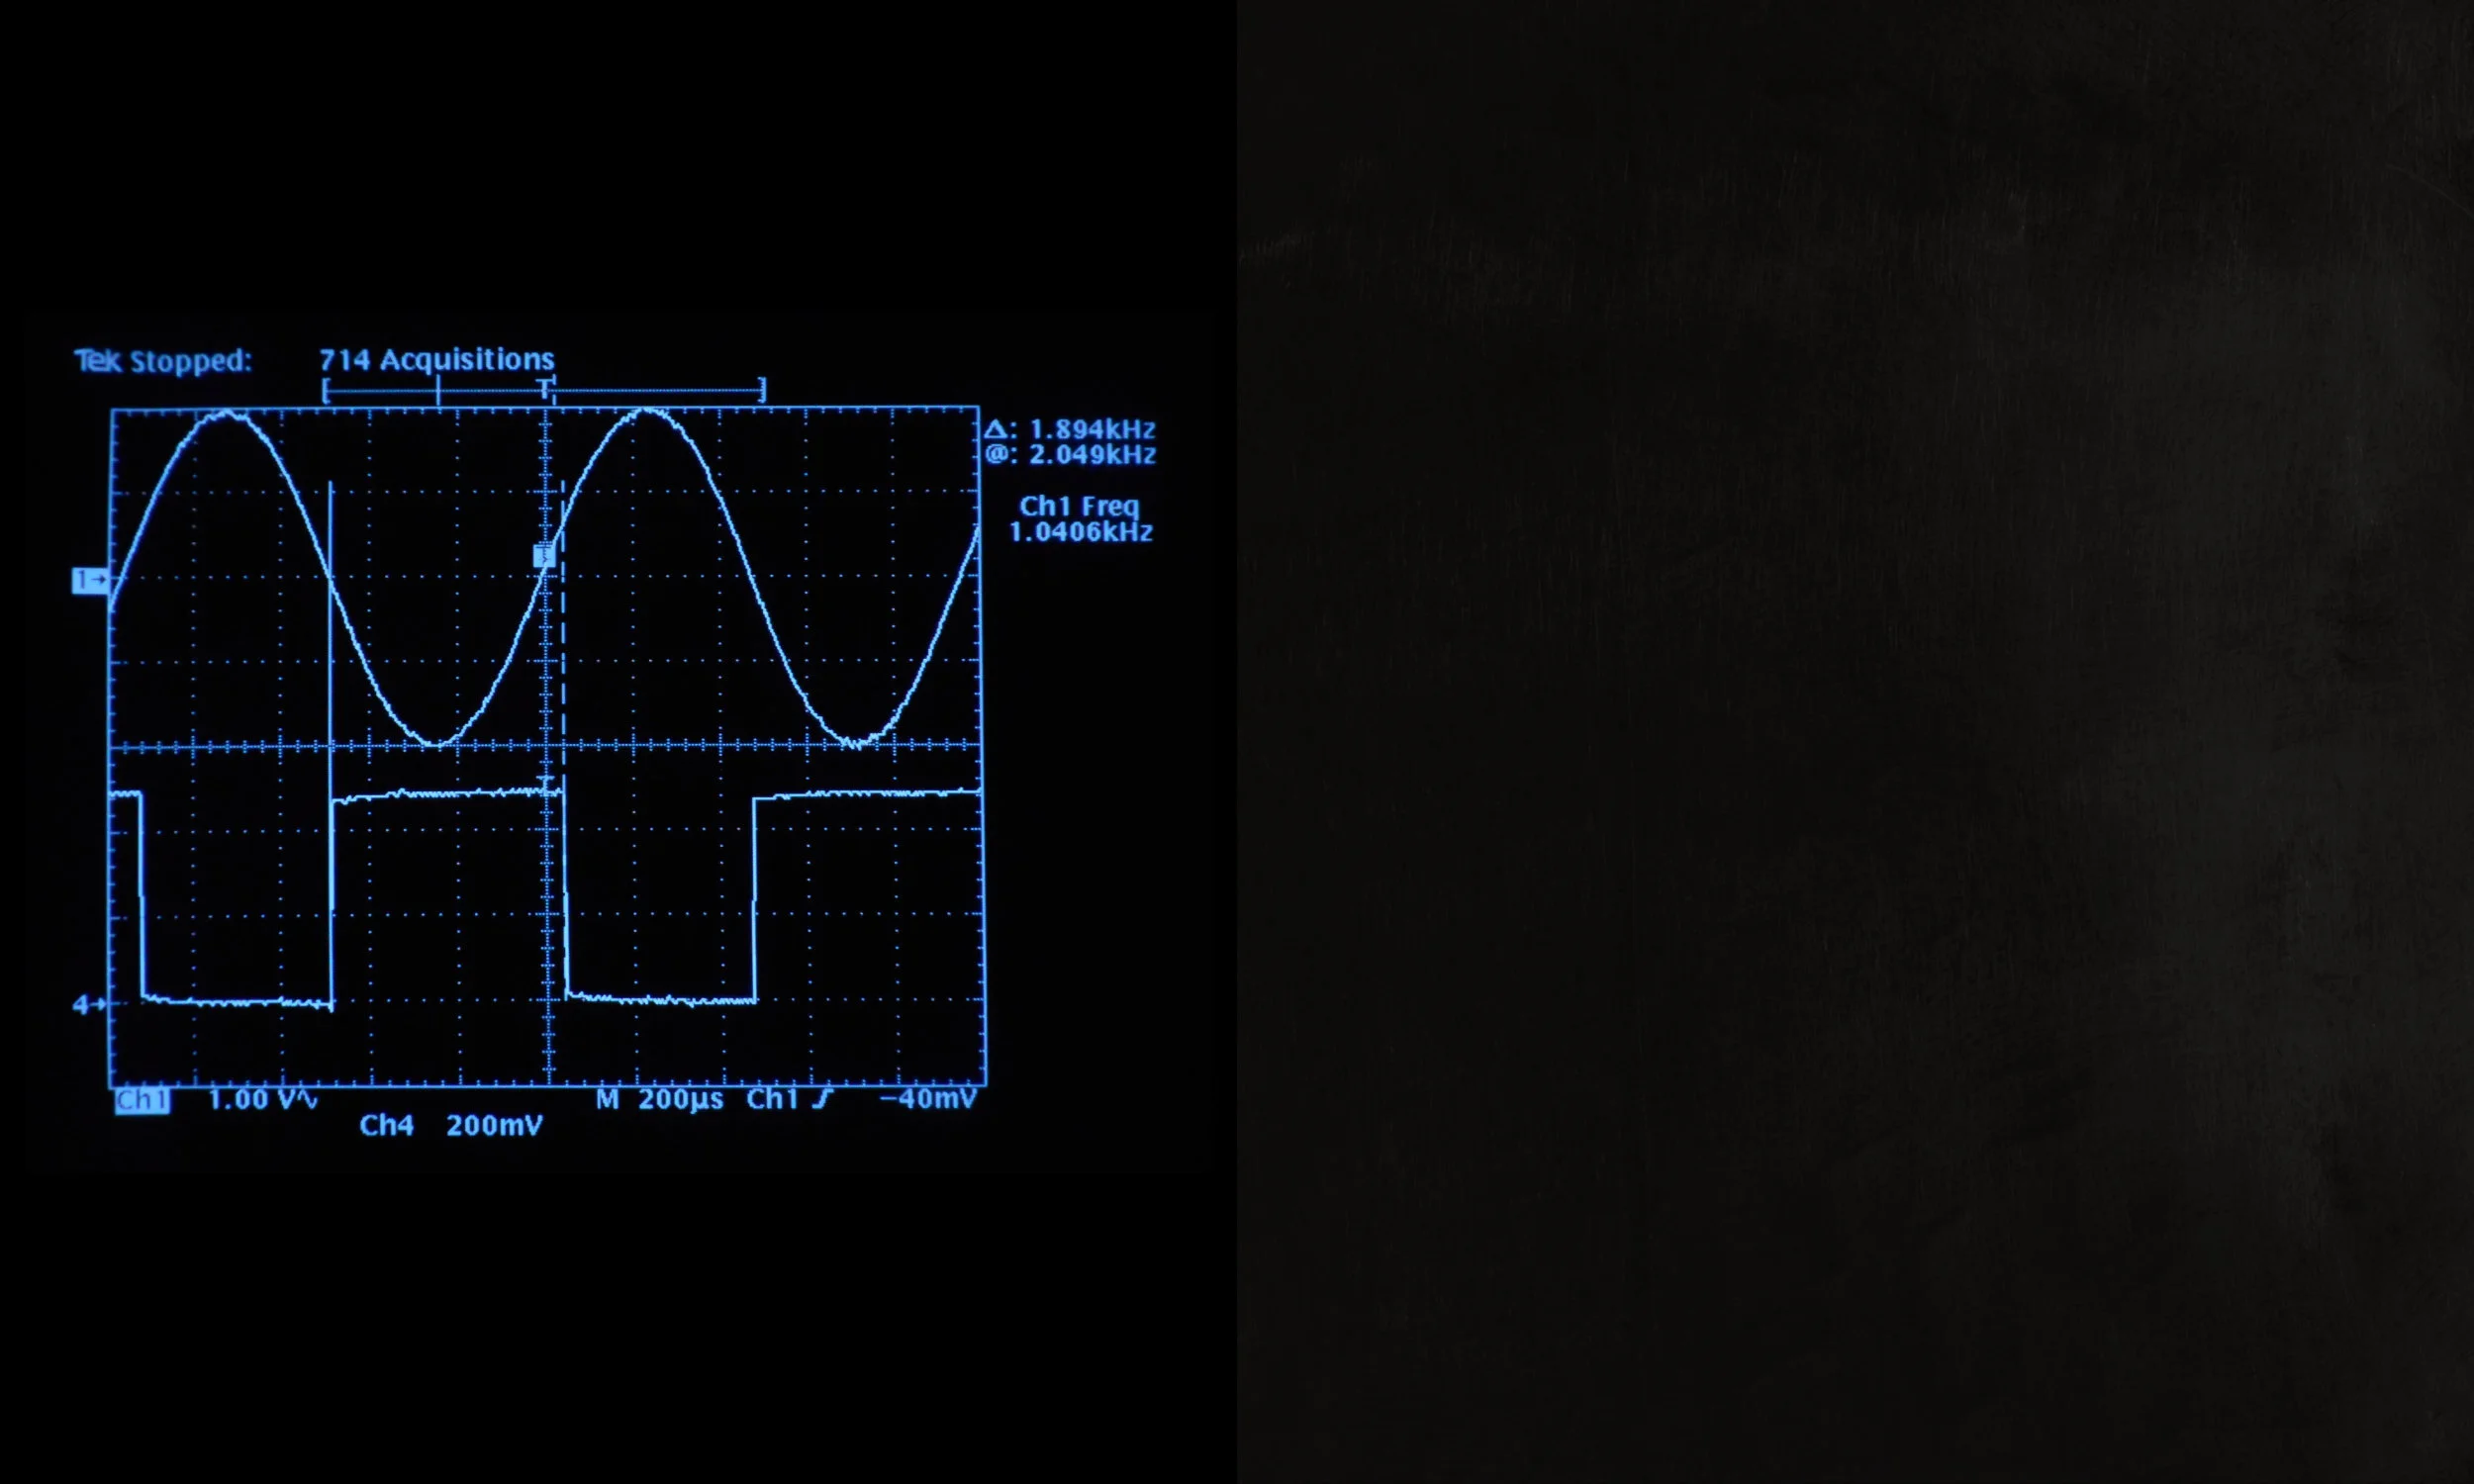
In order to get engine RPM data, we had to digitize a pulse train from a magnetic reluctance pickup. Except for a handful of light aircraft engines that are started by “hand propping” (where someone standing in front of the plane pulls down on the end of the propeller when the pilot hollers, “Switch on… Contact!”) all aircraft engines include a starter motor that engages with some kind of toothed flywheel.
We found a rugged, reliable magnetic reluctance pickup normally used in tractor-trailer truck transmissions, and when hung next to a spinning toothed flywheel gear, it produced something that looked remarkably like the sine wave show at the top of this oscilloscope image.
With a little bit of analog circuitry, we turned that sine into a 5V square wave pulse train suitable for use as a tachometer signal — plus or minus a few timing and counting circuits built into the microcontroller receiving the pulses.

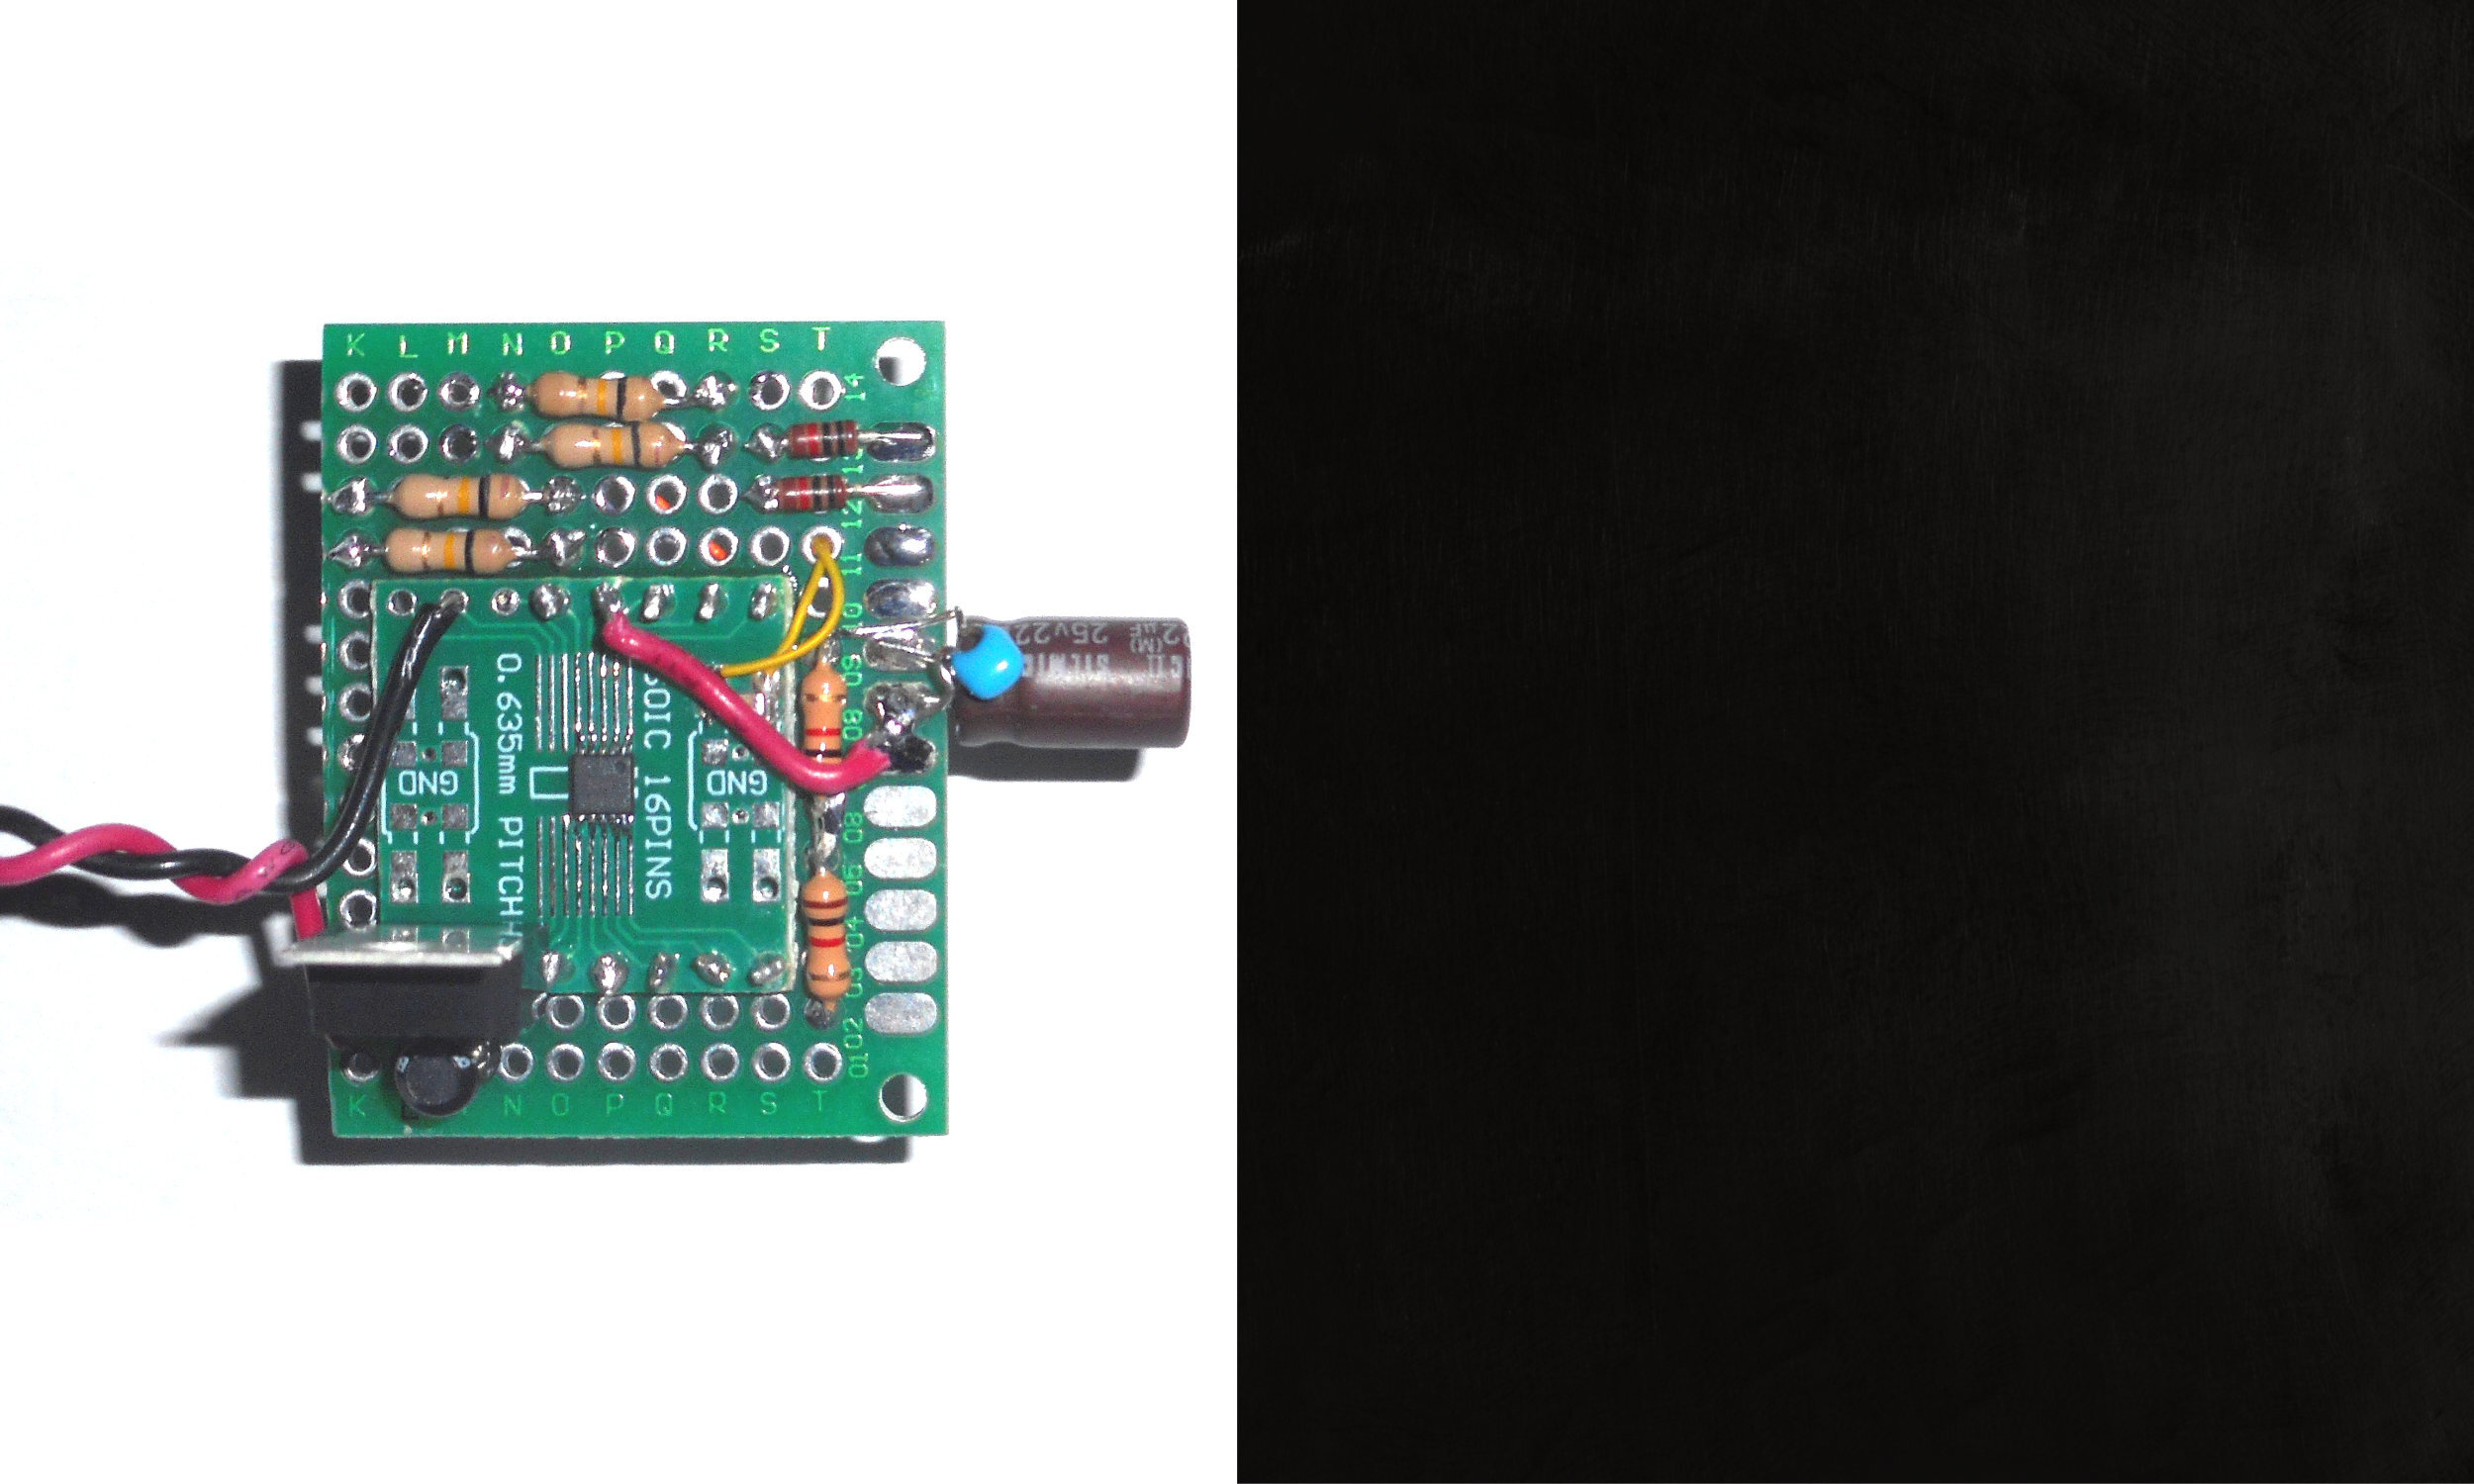
What We Did: Analog Front End Design Prototyping
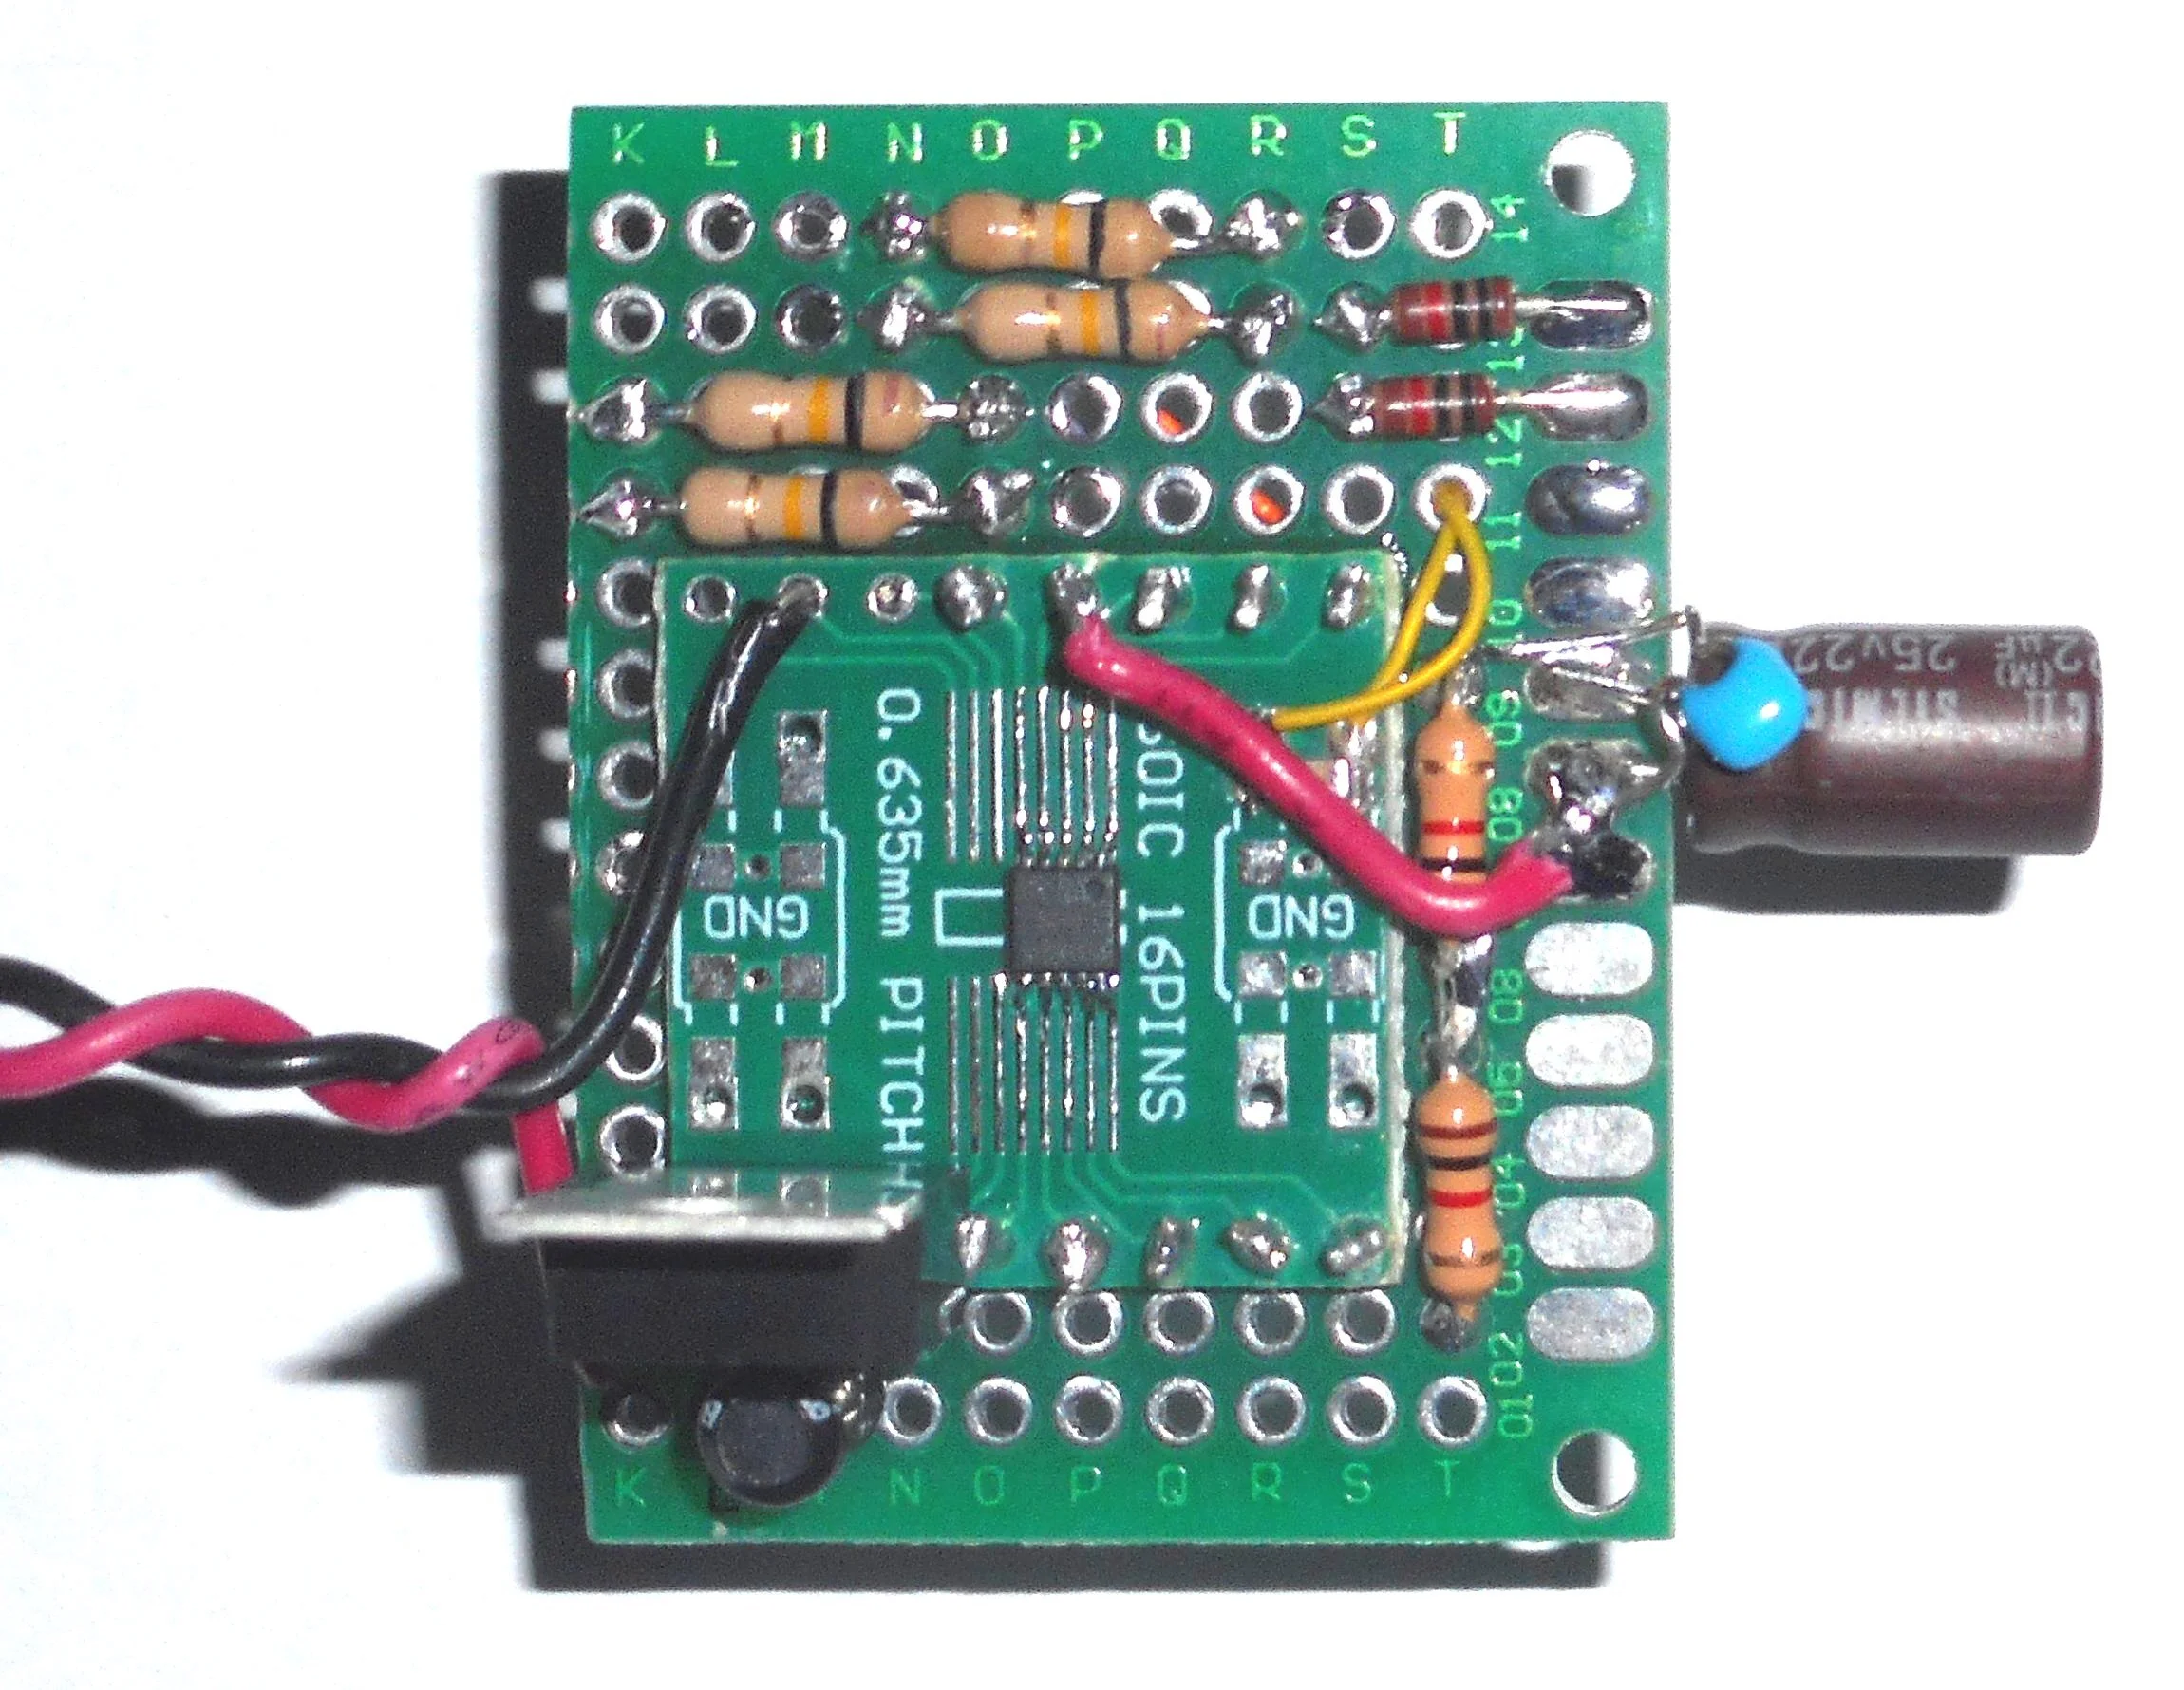
Again, we used a breadboard to test our theories. The SOIC-10 chip at the center of the photo combined some front end-amplifiers that could adjust bias and gain for the AC-coupled signal we fed it. And it also contained a few op-amps and a comparator with hysteresis to get the sine wave suitably rendered as a digital pulse train.
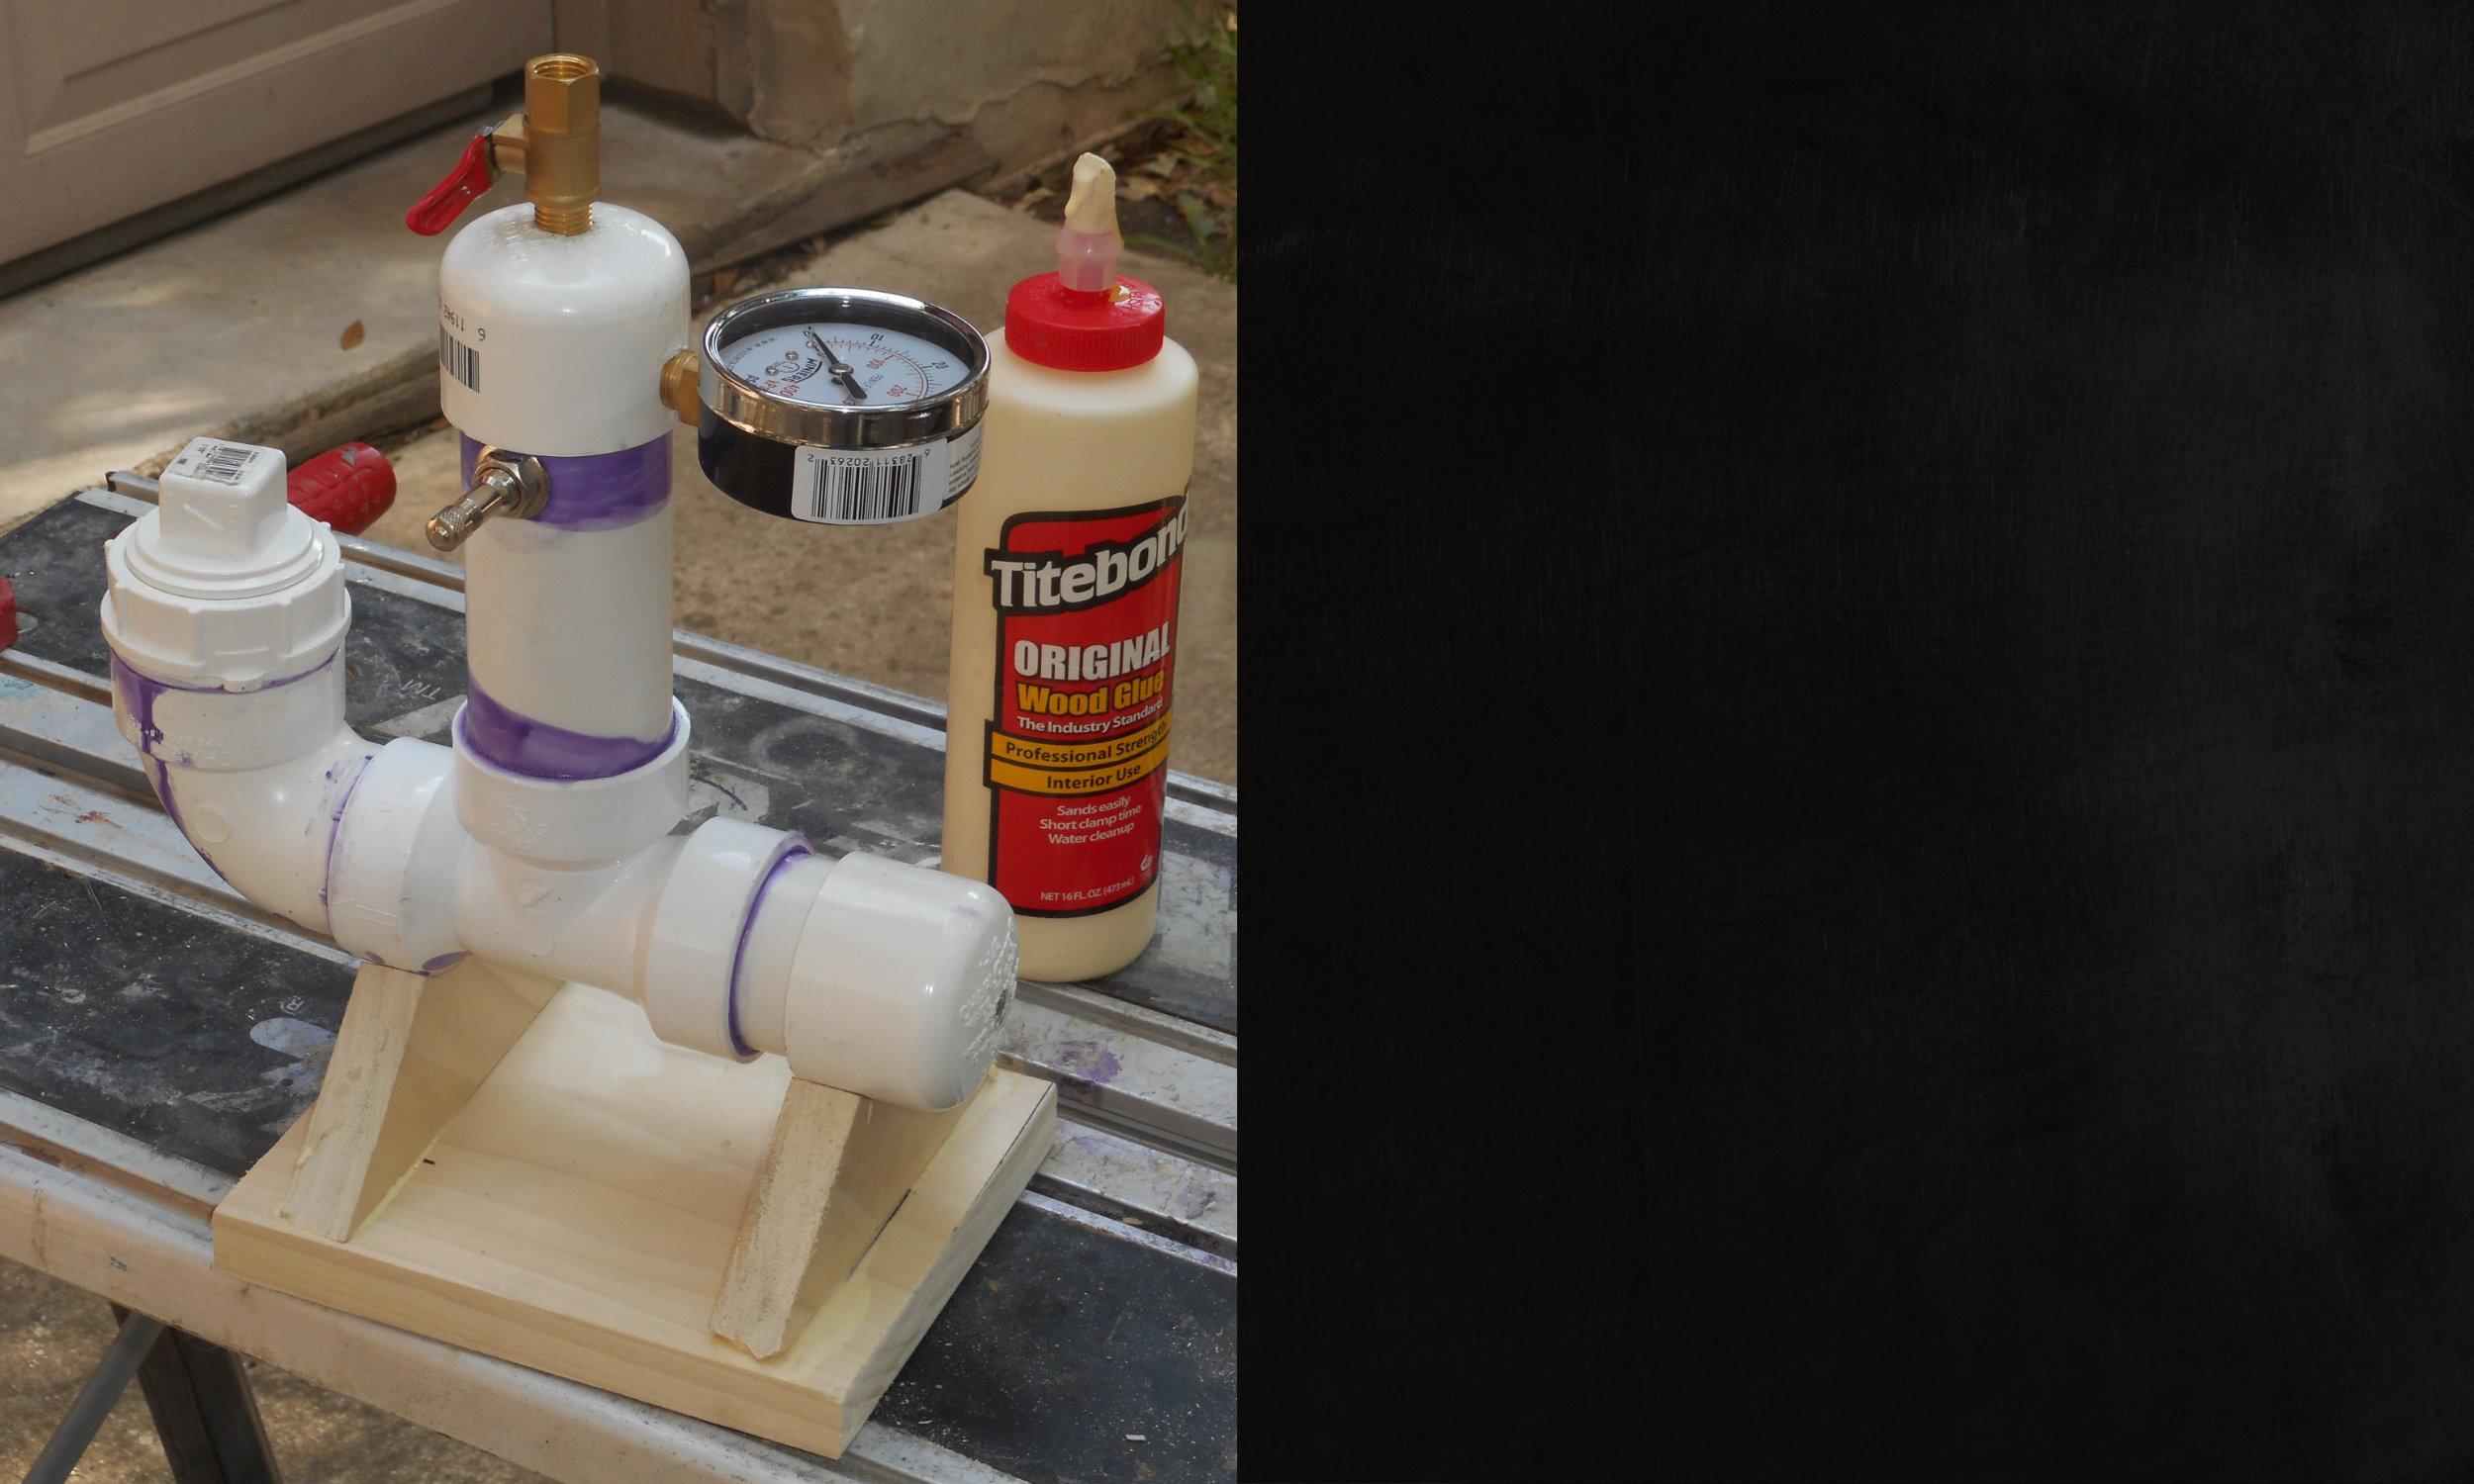
What We Did: Making a Fixture to Test a Pressure Transducer
It didn’t take a genius to determine that there’s a lot of stiction in a mechanical pressure transducer or that although once you’re past the point of stiction that dominates the lower pressure readings (somewhere around 10psi), things become a lot more linear. Of course, it’s at the low end of the oil pressure scale where things also are the most critical, since this is where lack of lubrication and pressure in things like hydraulic valve tappets lead to trouble. So we built a fixture we could fill with oil and to which we could connector our air compressor in order to see how repeatable our data curves were.

What We Did: Testing the Pressure Transducer
Using an air compressor, we pressurized a homemade PVC vessel to 60psi. The top half was air, and below that was motor oil (in which the sender end was immersed). Attached across the sender was a high-quality ohmmeter that measured its resistance. We then opened a valve and bled off the pressure to where it was back to “atmospheric.” We recorded all this on video so that we could go through the resulting footage frame-by-frame to pick out data points for “pressure versus sender resistance.”
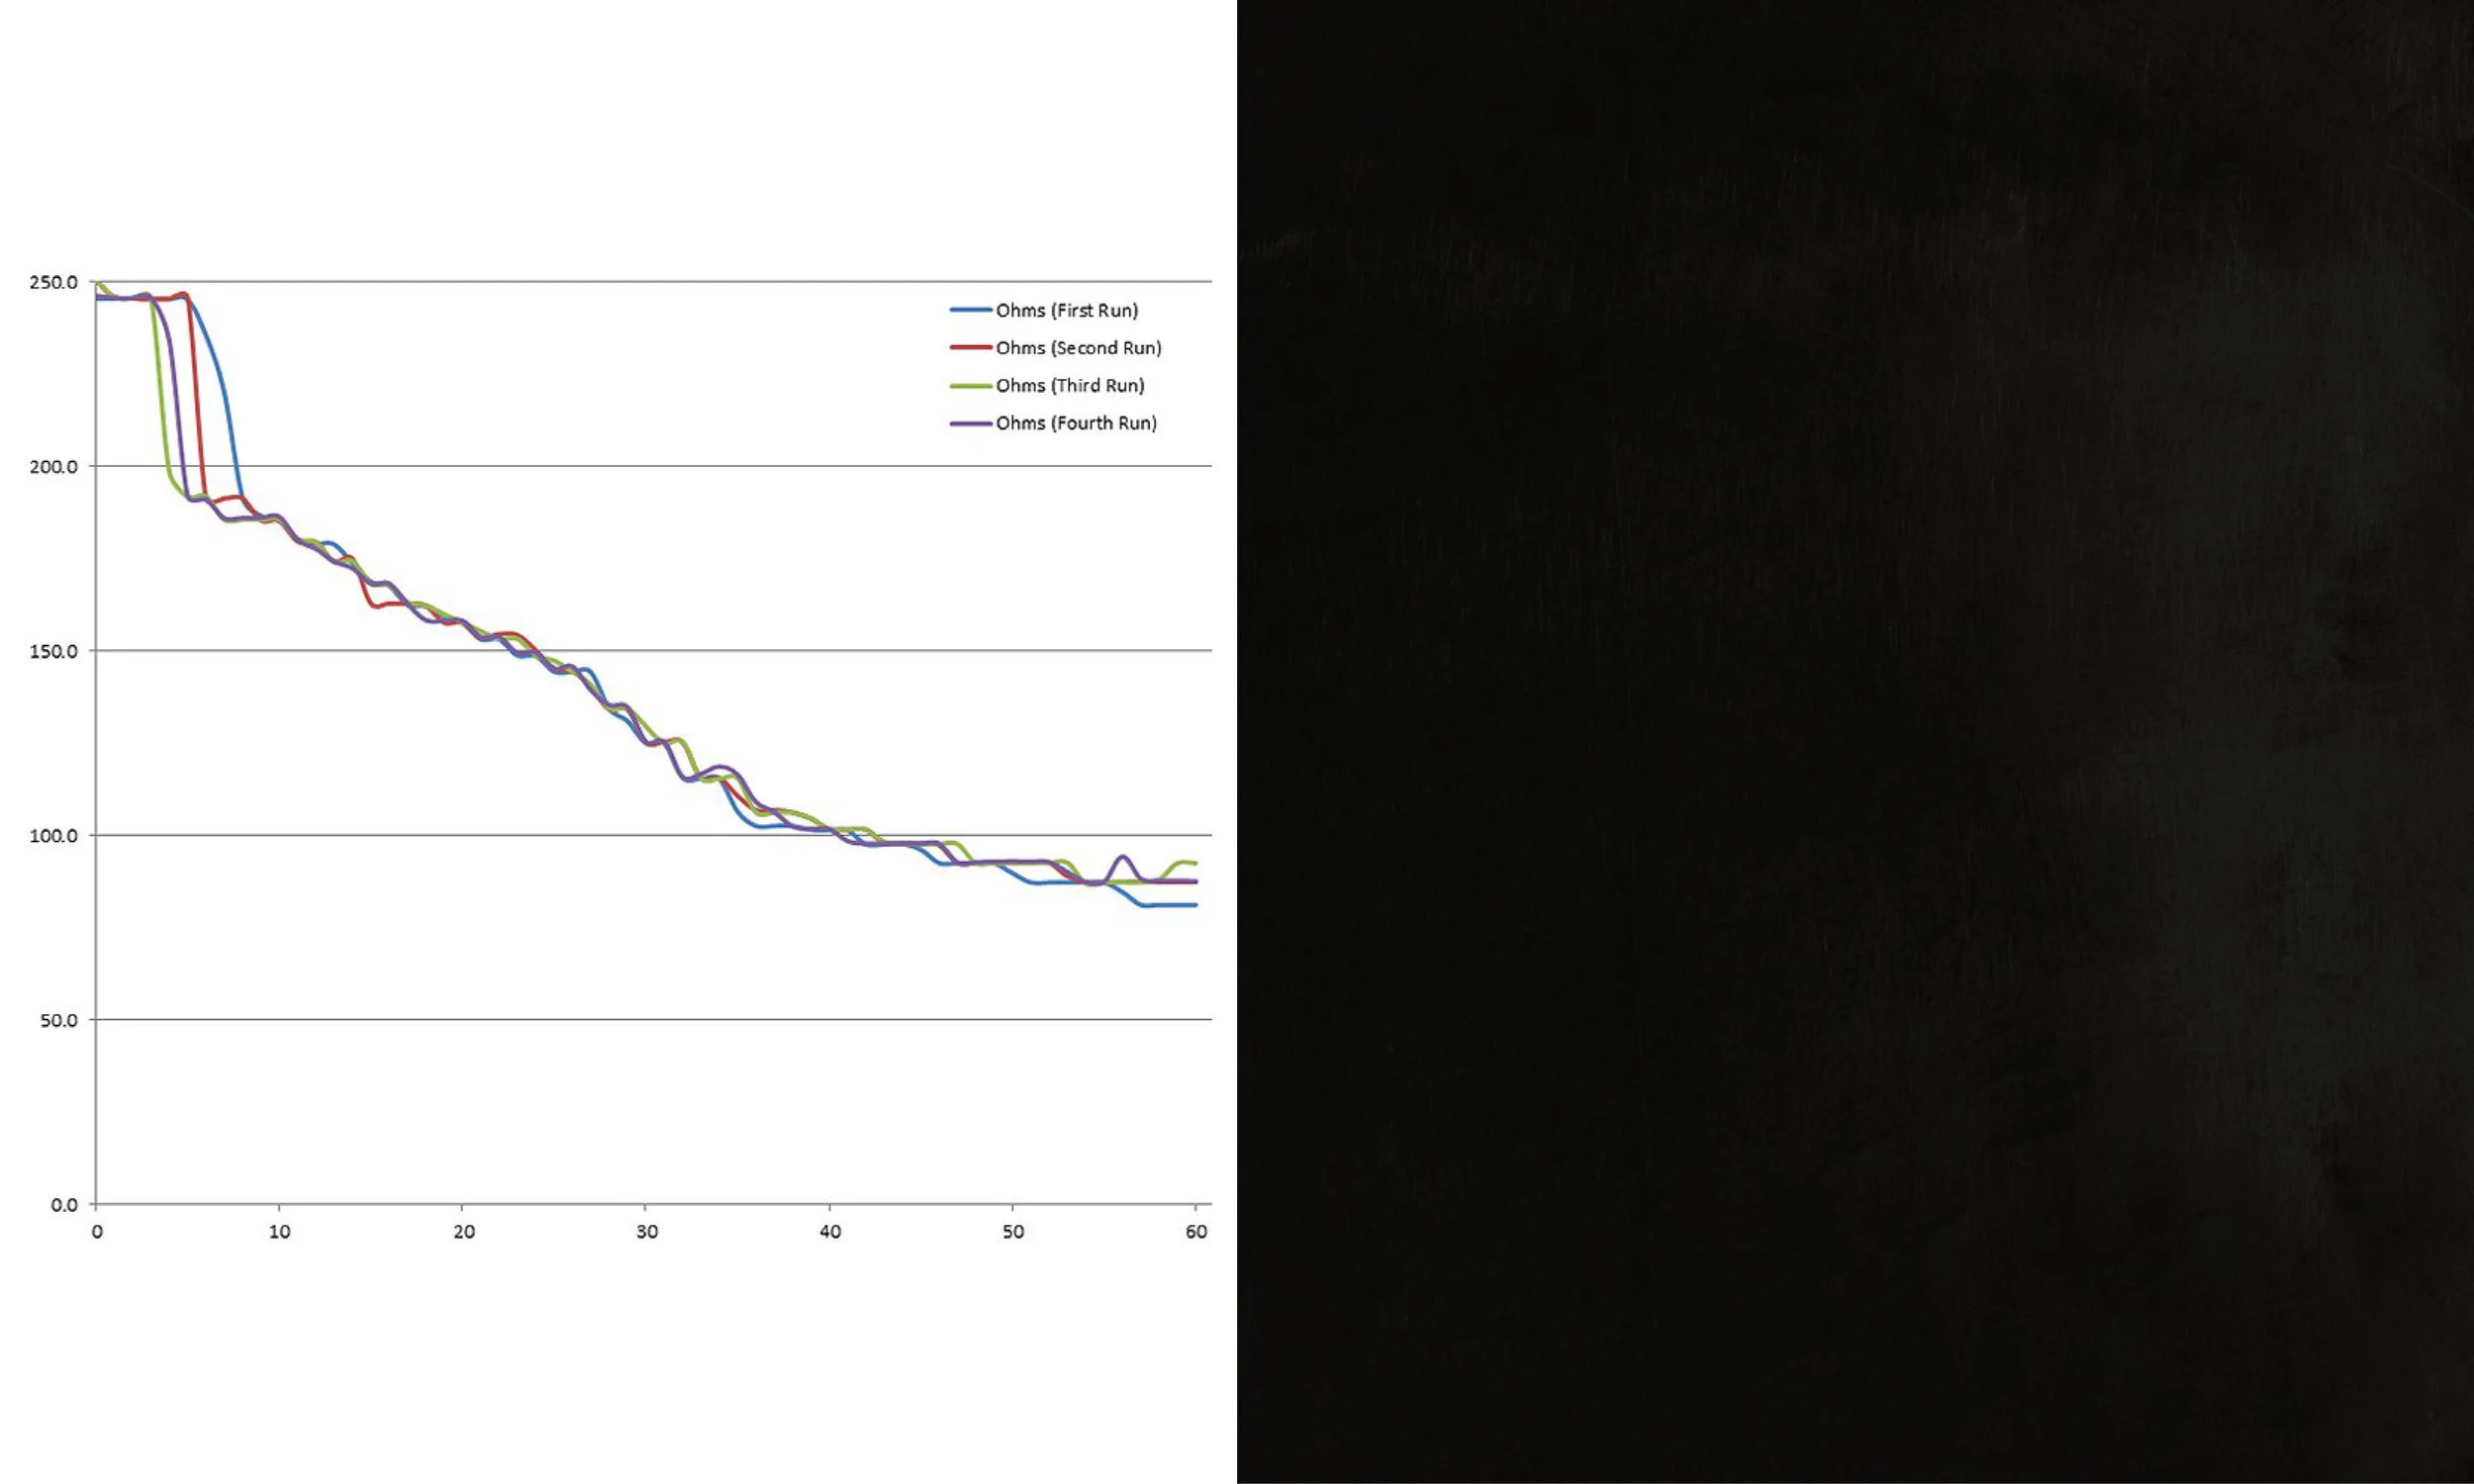
What We Did: Redacting Sensor Data
With four runs of our homemade pressure test vessel, we stepped through the videos frame-by-frame to read sensor resistance versus oil pressure. What we found was that (as we would have expected) at low pressures, forces of stiction inside the sensor mechanism dominate, even when the sensor is immersed in something lubricating such as oil. Above about 10psi things become reasonably linear, with only a mild change-of-slope inflection at around 40psi.
What was more to the point (and to our liking) was that the curves were highly repeatable, so even though they were nonlinear in places, we could still devise a lookup table to translate them to meaningful real-world data.

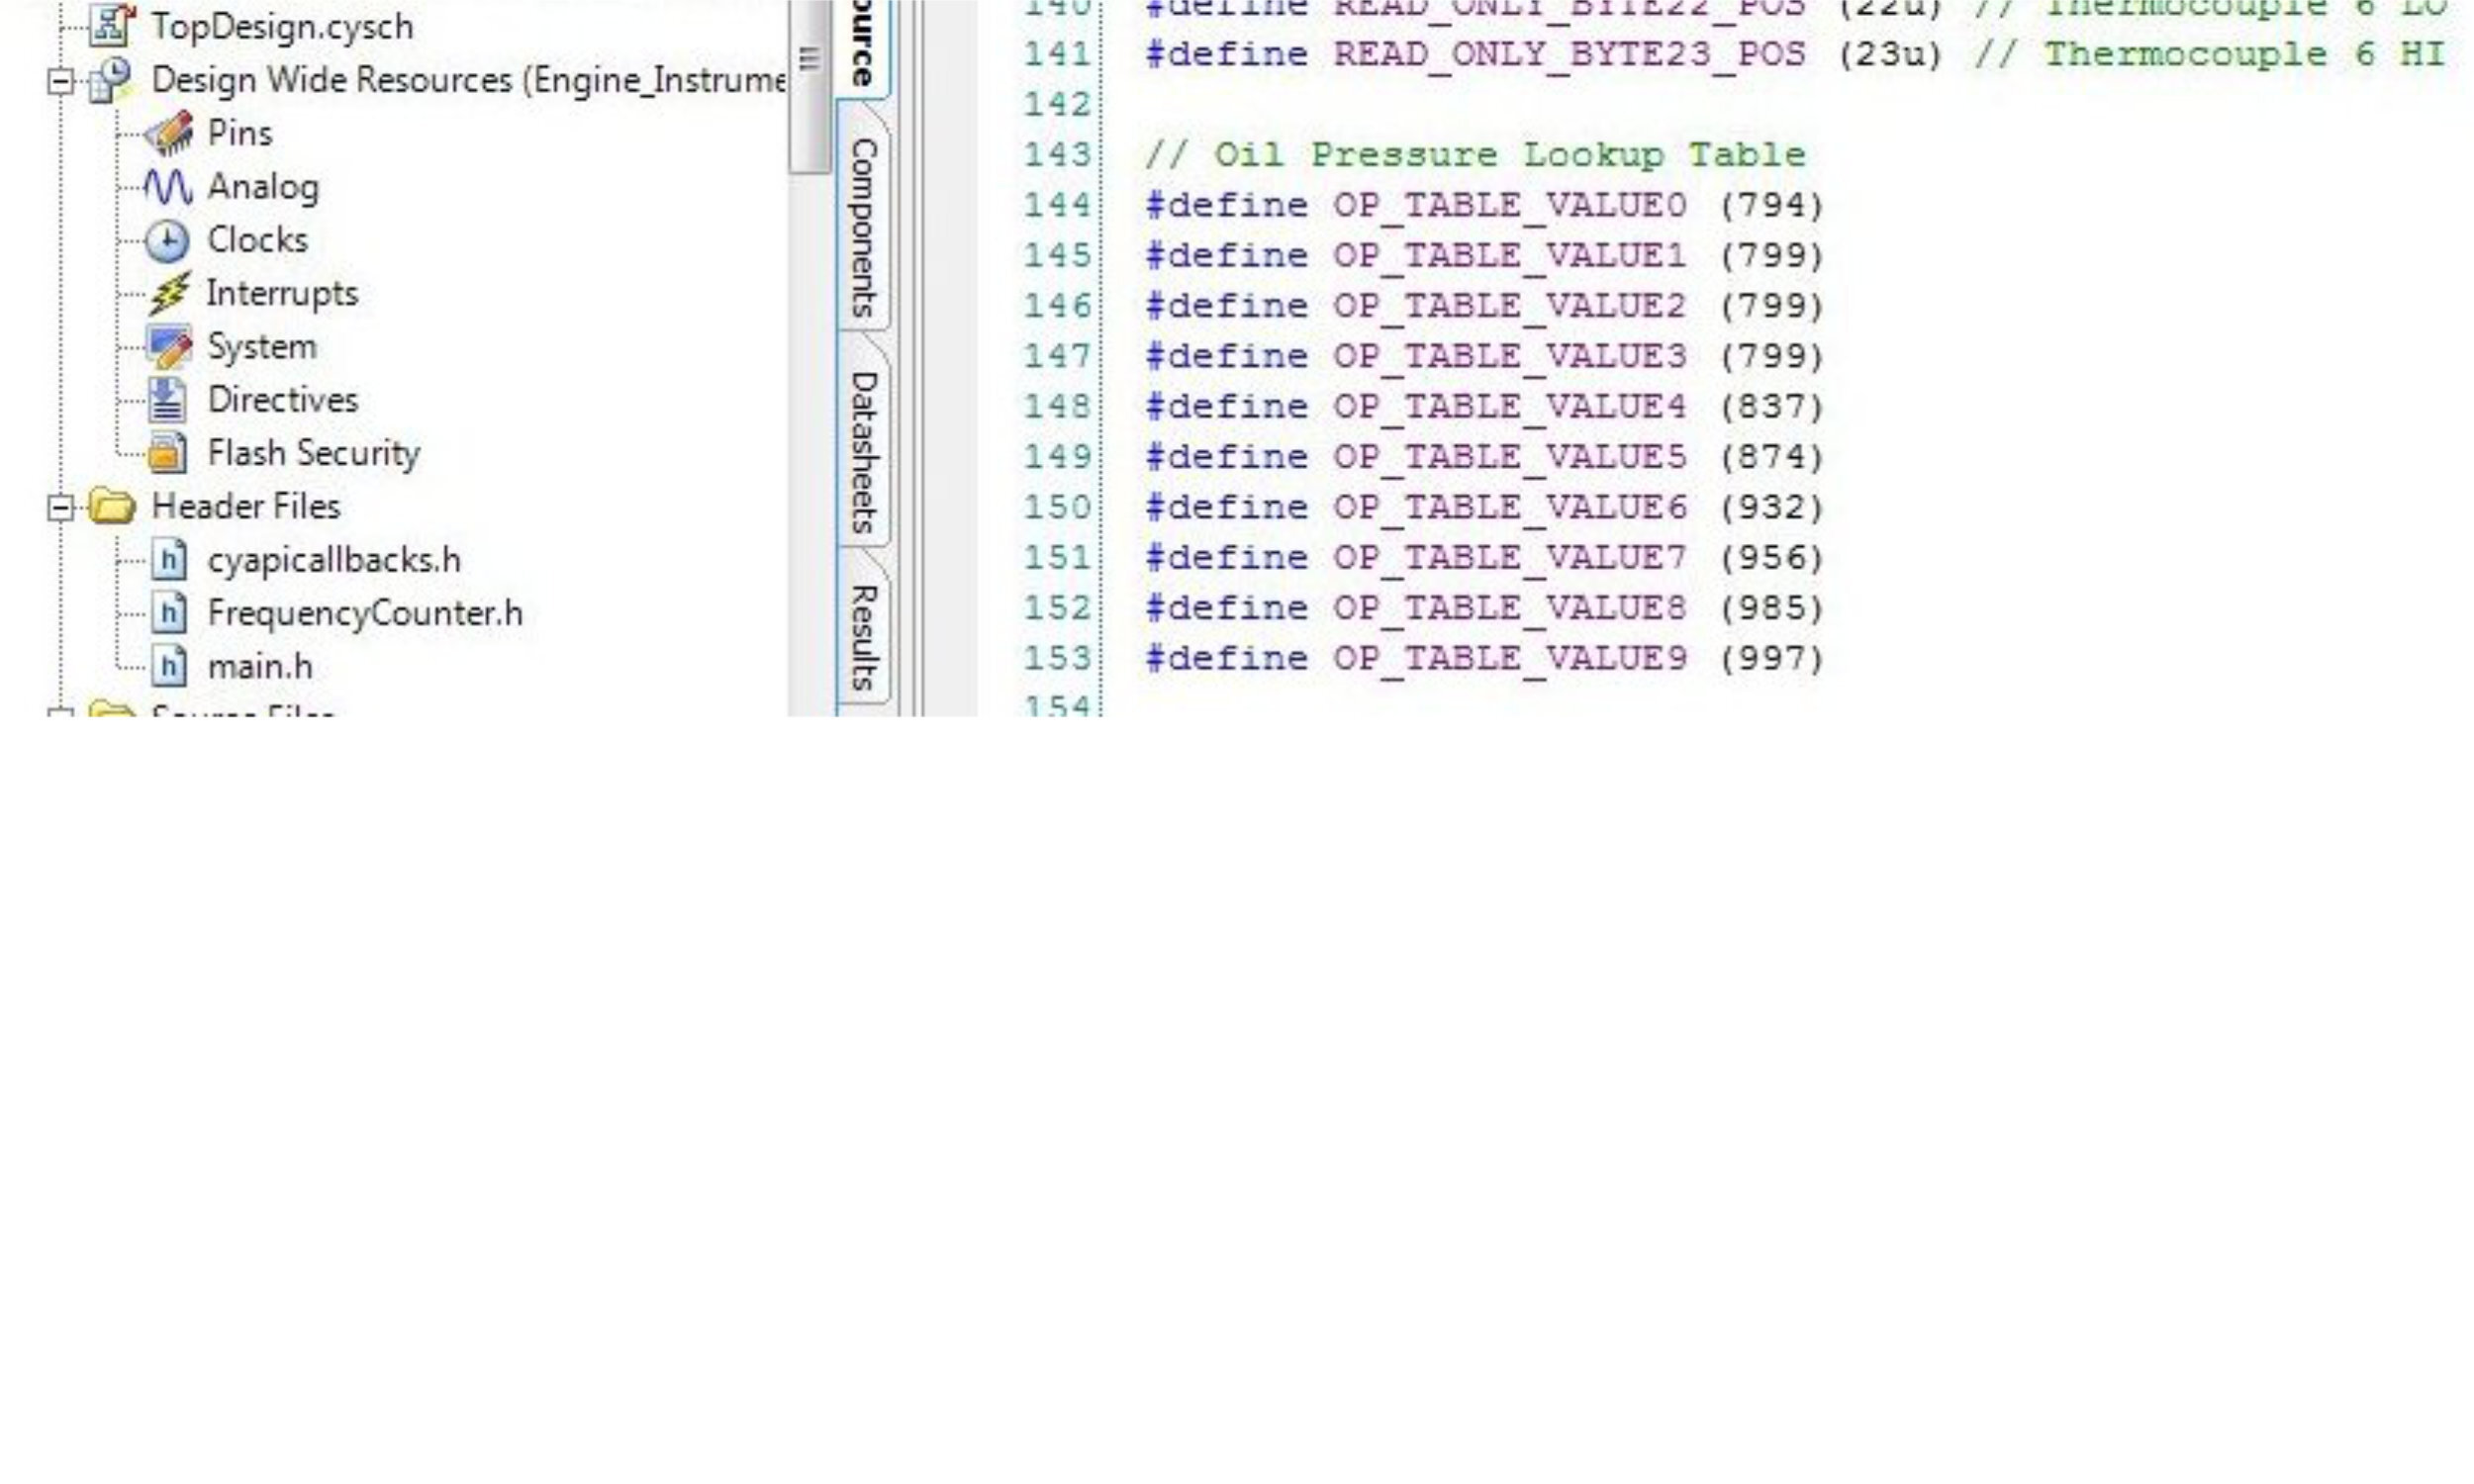
What We Did: Getting Practical with Data
Armed with actual data from a few runs of pressure testing, it was a relatively straightforward process to code a table in a C language header file to get us from pressure transducer readings to actual oil pressure.

What We’ve Been Doing: Testing the System
Testing the system has been an onogoing process. This video shows us taking readings of engine speed using a handheld tachometer and a mockup of a spinning flywheel gear on an engine (with magnetic reluctance pulses coming off our chosen pickup).
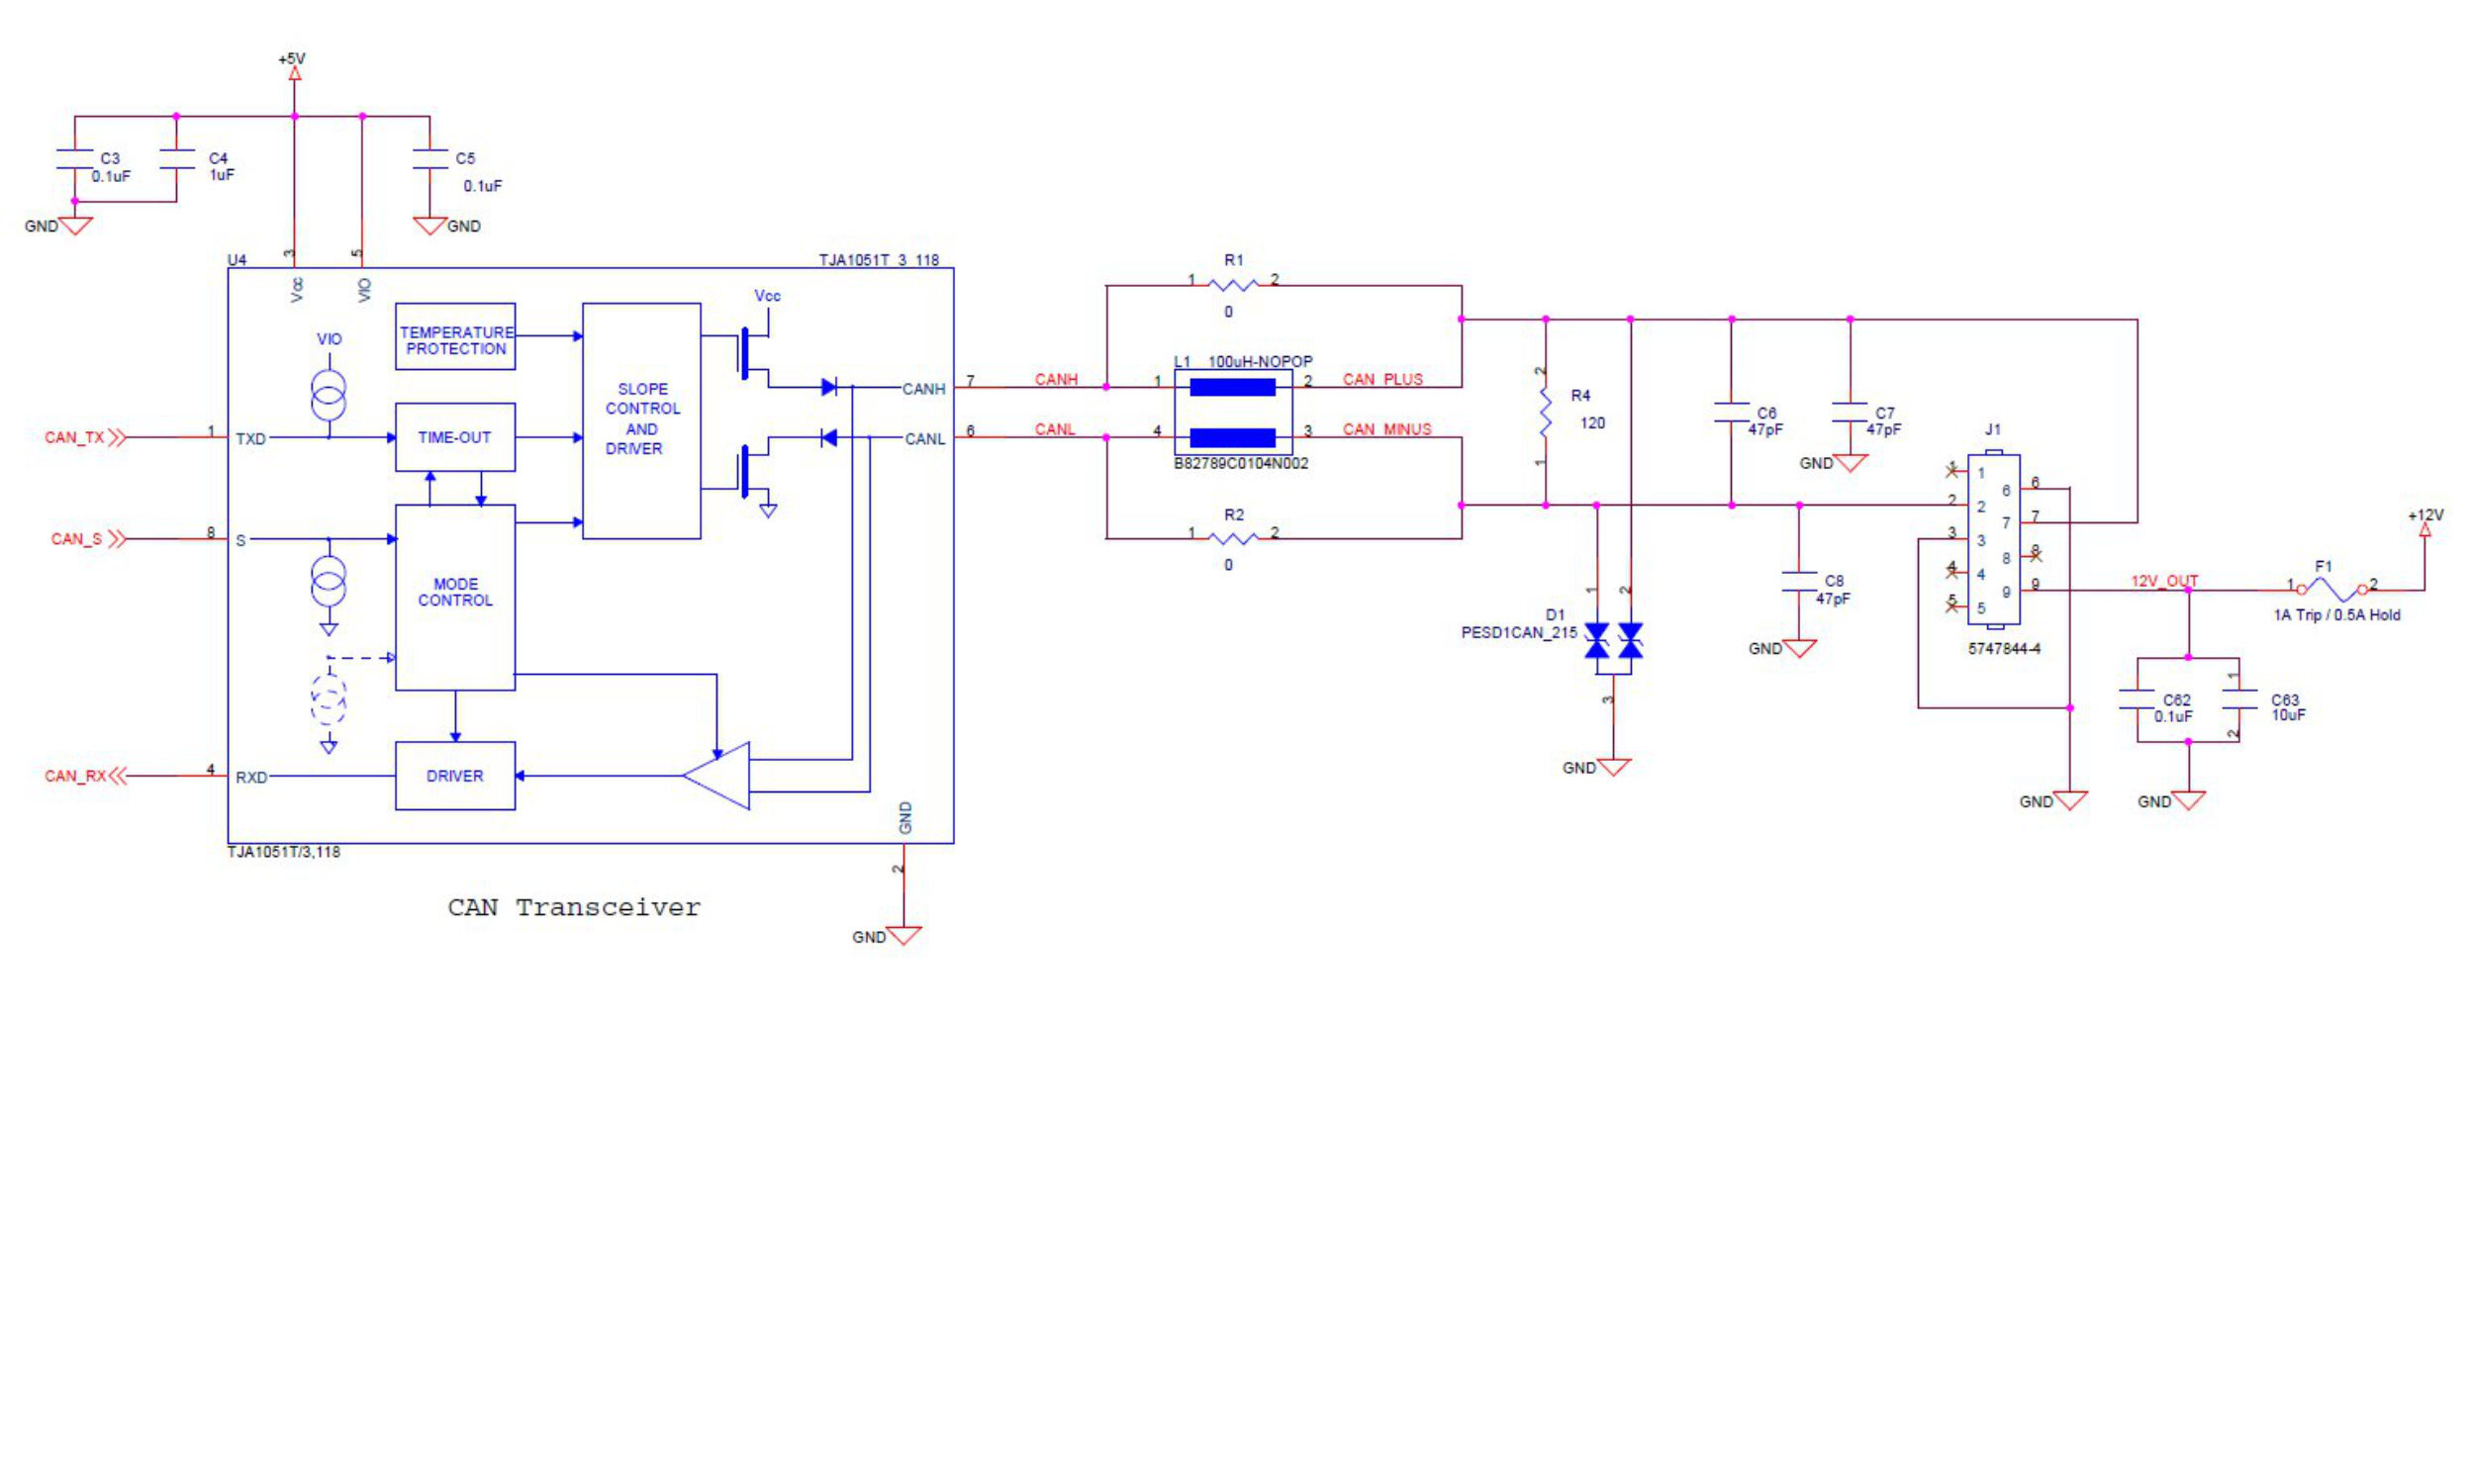
What We Did: CAN Bus Design
With all the sensor data gathered and concatenated, the job became attaching a CAN transceiver and writing the code to logically connect mailboxes to their corresponding sensors as outlined in the CAN Aerospace specification.
Our system uses a smart CAN line driver that can sense when the controller may have lost its mind and can get it off the bus if it does — so it doesn’t jam up other devices.

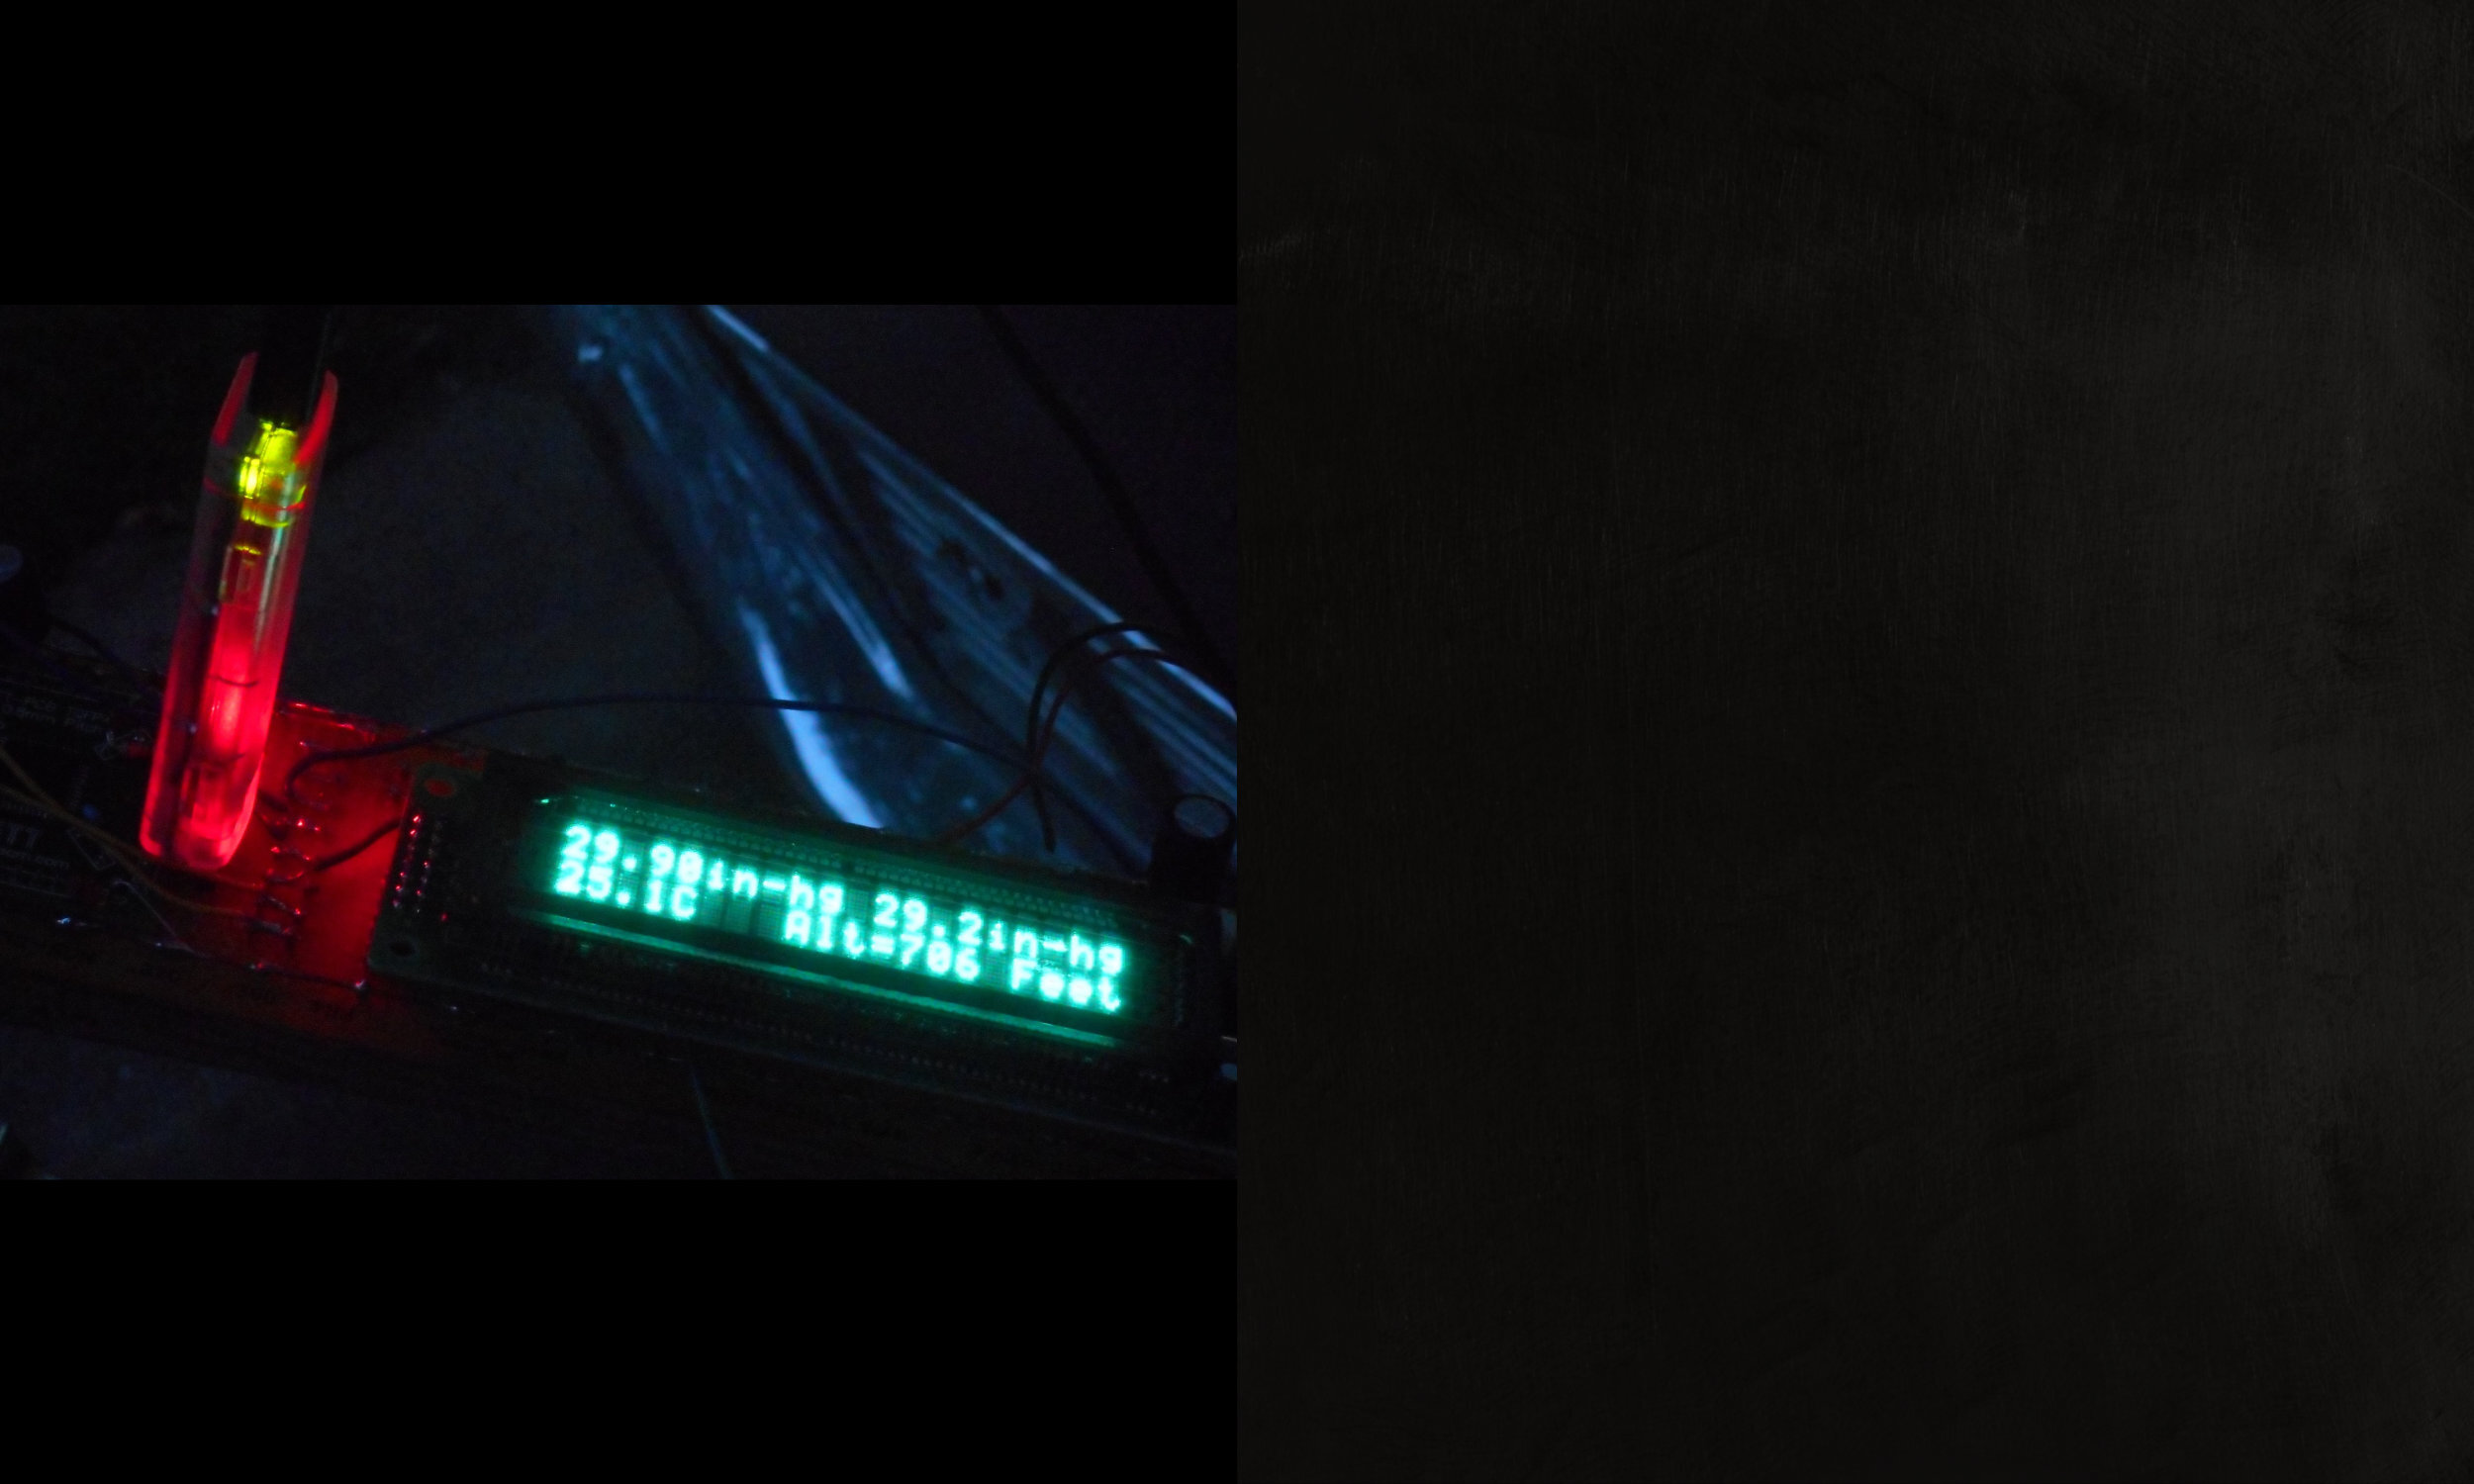
What We Did: Integrating “Basic Six” Sensors
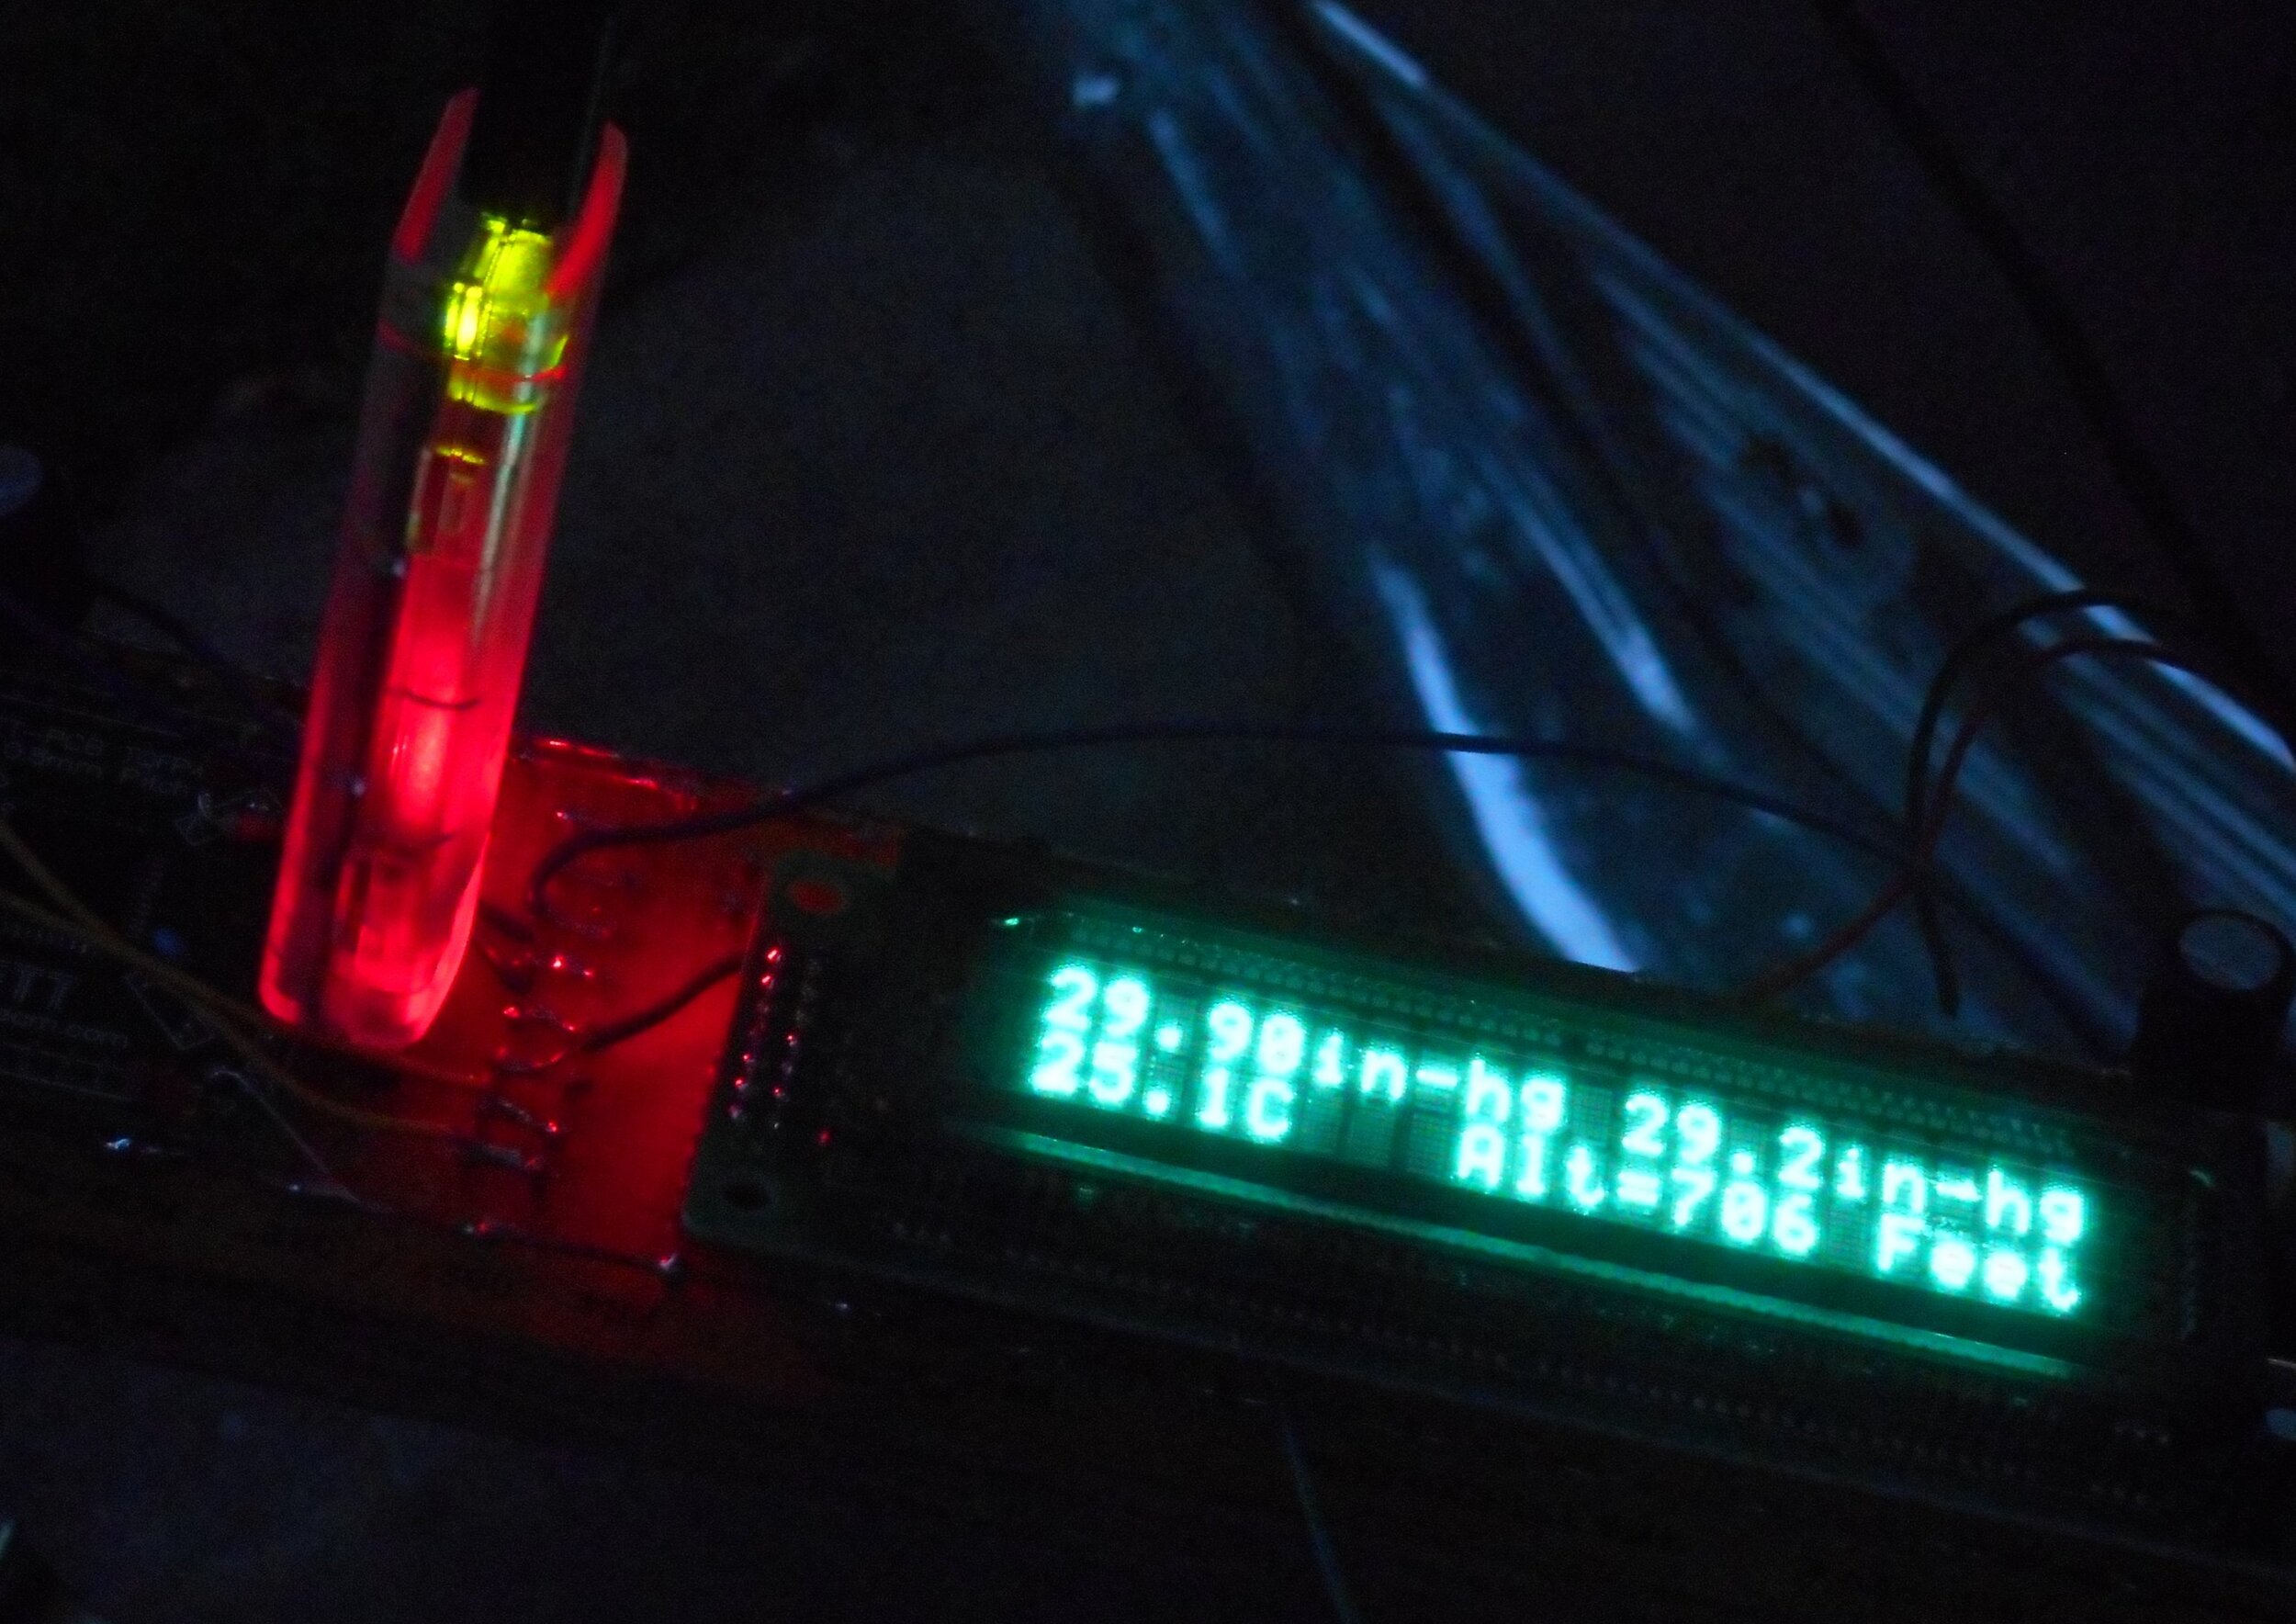
Although we’re primarily concentrating on creating an engine monitor, we’ve also been experimenting with atmospheric pressure transducers to see if we can implement an altimeter as well as transducer for “pitot” and “pitot static” pressures to determine airspeed. In this image, you can see where we’re playing with an altimeter made from a micromachined silicon pressure transducer. Here the transducer and a temperature sensor are reporting a barometric pressure of 29.2 inches of mercury at 25.1 degrees Celsius temperature. And with the local airport (at a sightly lower altitude than our laboratory) reporting 29.90 in-Hg, we deduce our altitude to be 706 feet above sea level. (A topographic map shows we’re at 704 feet, so we’re well within a reasonable amount of error.)
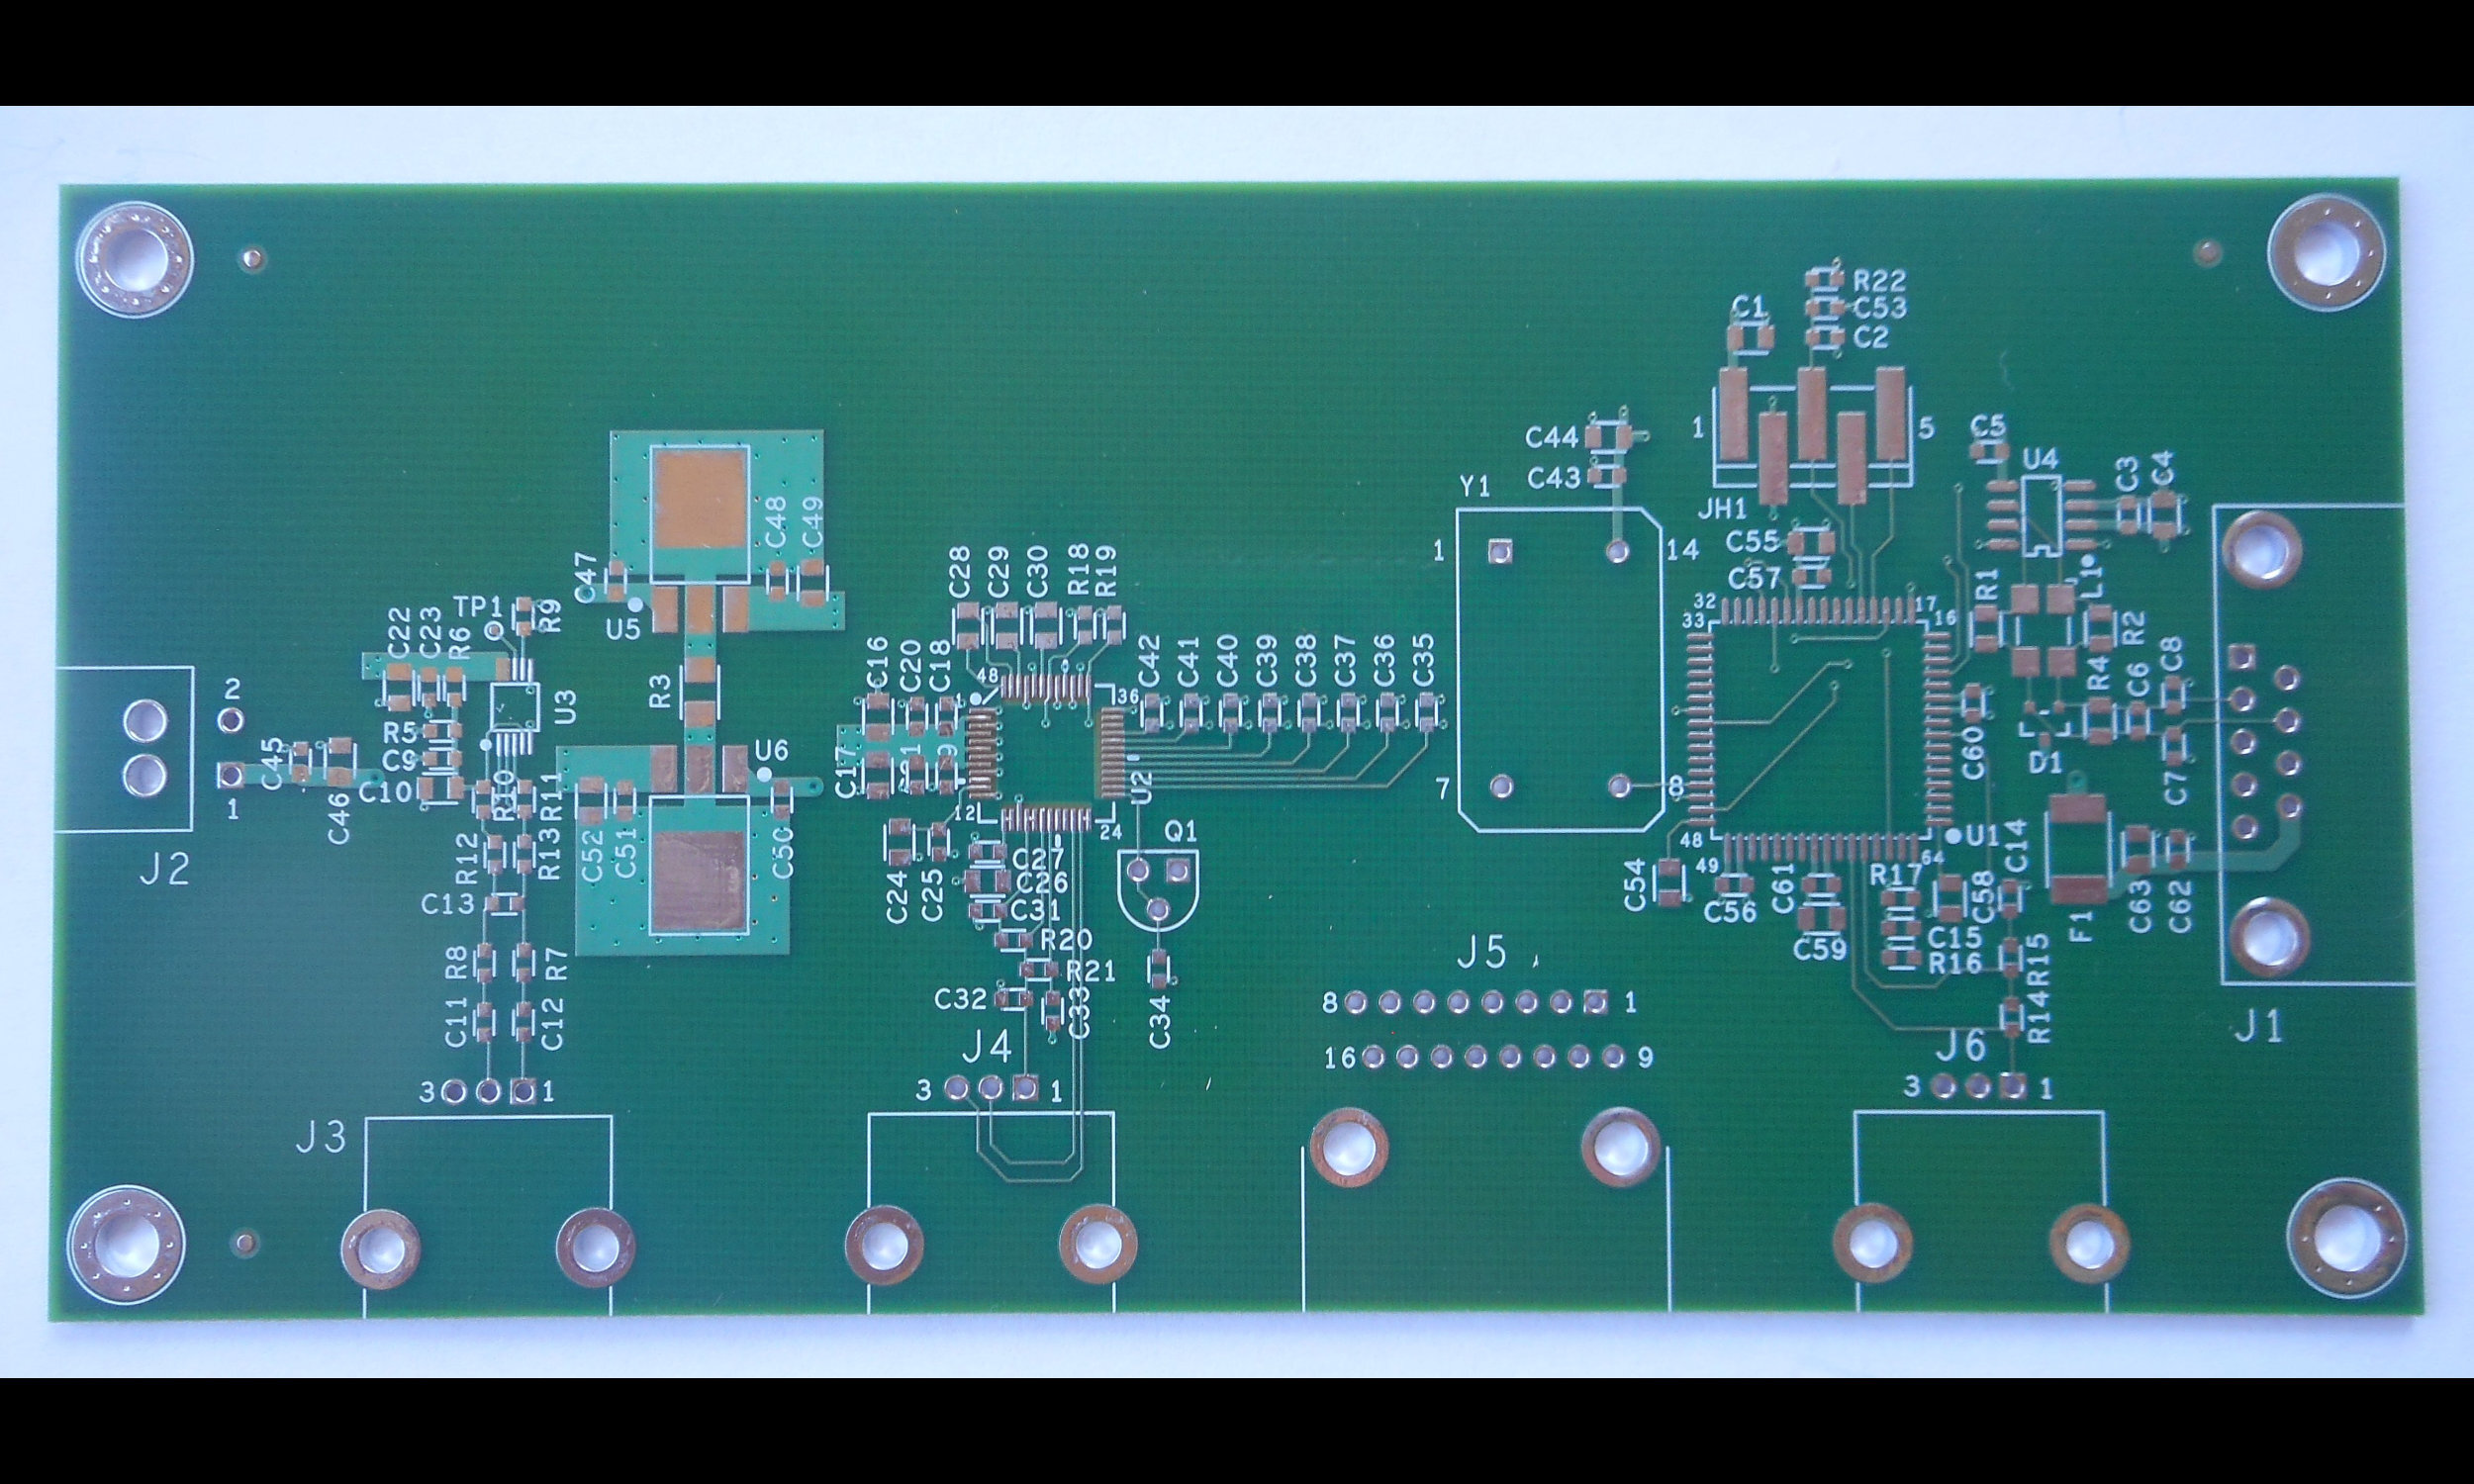
What We Did: Fabricating the PCB
Once we had the code figured out and a prototype running, we reduced the design to a PCB suitable for manufacture. And we selected the high-reliability connectors required for an aviation application.
